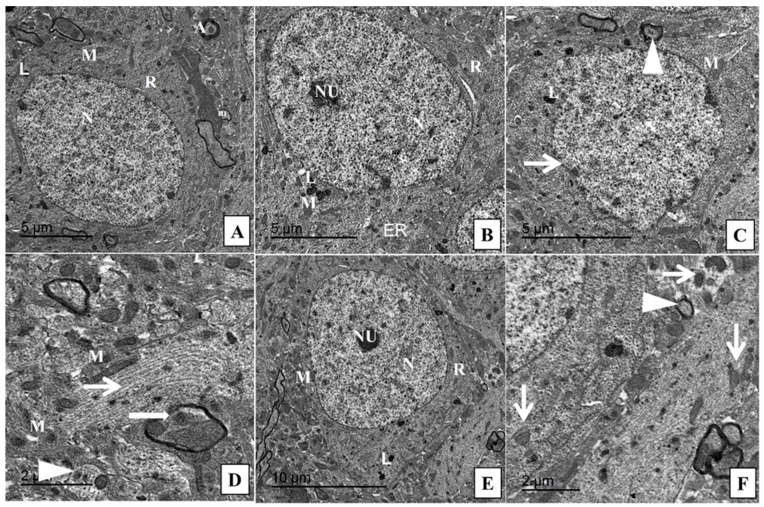
Figure 4.
Transmission electron micrographs of hippocampus from different groups. (A) Control group showing the normal structure of the neuron with normal nucleus (N) and cytoplasm containing mitochondria (M), ribosome (R) with surrounding healthy myelinated axons wrapped by myelin (A) and axonal mitochondria (m). (B) CeNPs group showing the normal structure of the neuronal cells with intact nuclear envelope, distinct nucleoli, normal cytoplasmic organelles (mitochondria (M), ribosomes (R), lysosomes (L) and endoplasmic reticulum (ER)). (C) DOX group showing enlarged nucleus with blebs of nuclear envelope (thin arrow), loss of nucleolus and few irregular shaped mitochondria (M) with minimal degenerating sheaths surrounding a degenerated axon (arrowhead). (D) DOX group showing complete loss of myelin sheath (arrowhead), other area showing intact axon with gradual loss of myelin (thick arrow) beside dilated microtubules (thin arrow) intercalated with few irregular shaped mitochondria (M). (E,F) Treated group DOX + CeNPs showing the normal architecture of nucleus (N) with prominent nucleoli (NU) and most cytoplasmic organelles (mitochondria (M), lysosome (L) and ribosome (R) within the neurological cell. (F) Higher power showing with minimal mitochondrial membrane losses (thin arrows) either inside and around the neuronal cell with minimally affected sheath (arrowhead). Scale bar = 5 µm (A–C), 2 µm (D,F), 10 µm (E).

