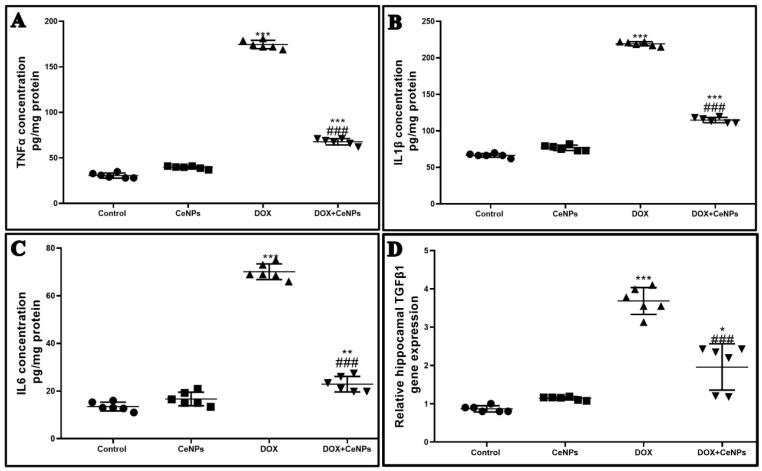
Figure 6.
Effect of nanoceria treatment on proinflammatory markers measured by ELISA and on relative gene expression of TGF-β in different groups of rats. (A) TNFα protein expression. (B) IL1β protein expression. (C) IL6 protein expression. (D) relative gene expression of TGF-βin different groups of rats. All data are expressed as mean ± SD, (one-way ANOVA test followed by Tukey post hoc test was used for data analysis, *** p < 0.001, ** p < 0.01, and * p < 0.05 vs. control group, ### p < 0.001 vs. DOX group.

