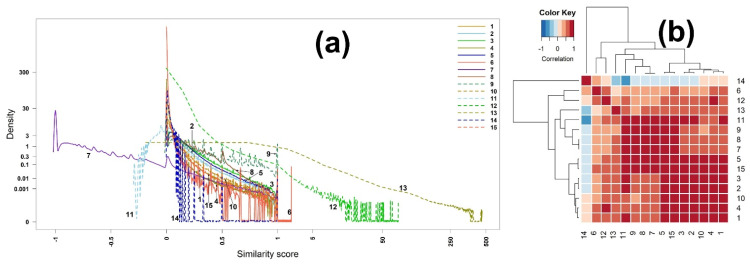
Figure 4.
(a) Densities and (b) heatmap of the correlation matrix of scores among all 15 binary similarity measures for ESI mass spectra-based compound identification. The correlation was calculated using Pearson’s correlation coefficients. The horizontal red solid line indicates the four clusters generated by hierarchical clustering. The numbers in row and column represent the indices of binary similarity measures corresponding to Table 4 of Section 4.

