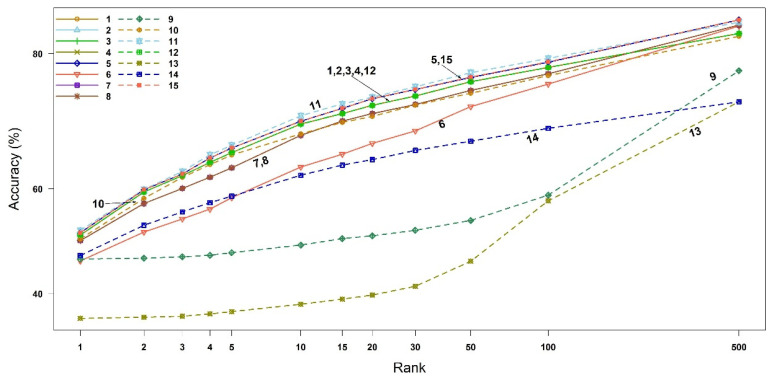
Figure 5.
Accuracy of all similarity measures for ESI mass spectra-based compound identification by rank. The x-axis represents the ranks and the y-axis the identification accuracy. The numbers in legend and plot are the indices of binary similarity measures corresponding to Table 4 of Section 4.

