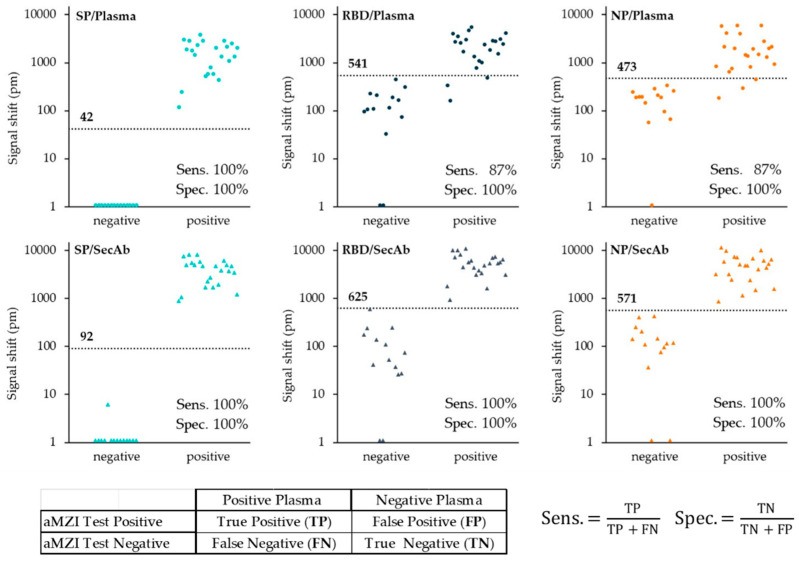
Figure 10.
Binding signal distribution of 23 anti-SARS-CoV-2 antibody positive and 14 anti-SARS-CoV-2 antibody negative human plasma samples obtained for the plasma incubation (direct assay: top row) and the secondary antibody incubation (indirect assay: bottom row) shown for the SP (left), RBD (middle) and NP antigen (right). Note 1: for the SP assay, all but one of the negative plasma samples had a small negative binding signal (mean ± standard deviation: −32 ± 13 pm). In order to enable logarithmic presentation all negative values were assigned a value of 1 picometer. Note 2: the small table and the equations at the bottom explains how the sensitivity and specificity was calculated.

