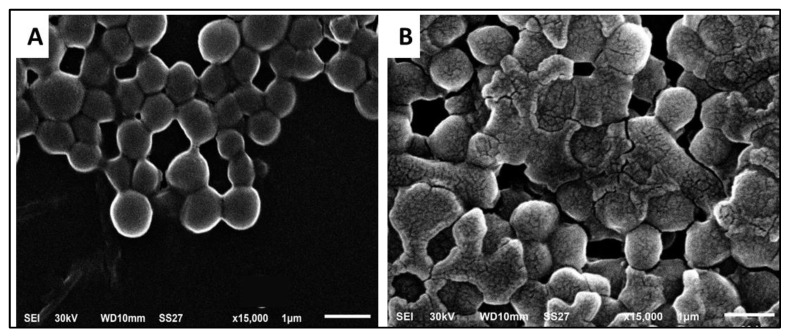
Figure 8.
Scanning electron micrographs of a demonstrative E. faecalis isolate. Where (A) is before treatment with SOTE showing all the cells are most probably normal, with smooth surface and the cell wall of the bacterial cells is regular (×15,000); (B) is after treatment with SOTE, showing distortion and rupture of cell wall of some cells (×15,000).

