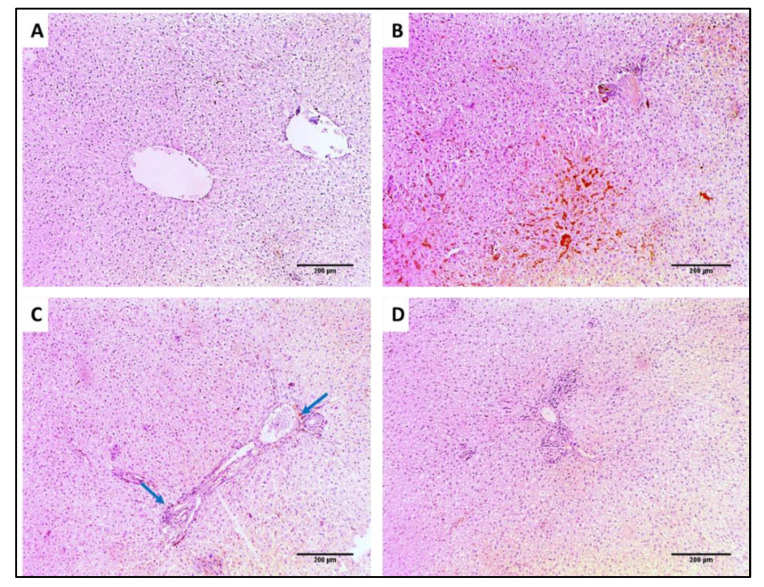
Figure 17.
TNF-α immunostained sections of: (A) Normal liver showing negative TNF-α staining, score 0 (×100). (B) Liver of group I showing strong TNF-α staining, score 3 (×100). (C) Liver of group II showing weak TNF-α staining, score 1 (blue arrows) (×100). (D) Liver of group III showing negative TNF-α staining, score 0 (×100).

