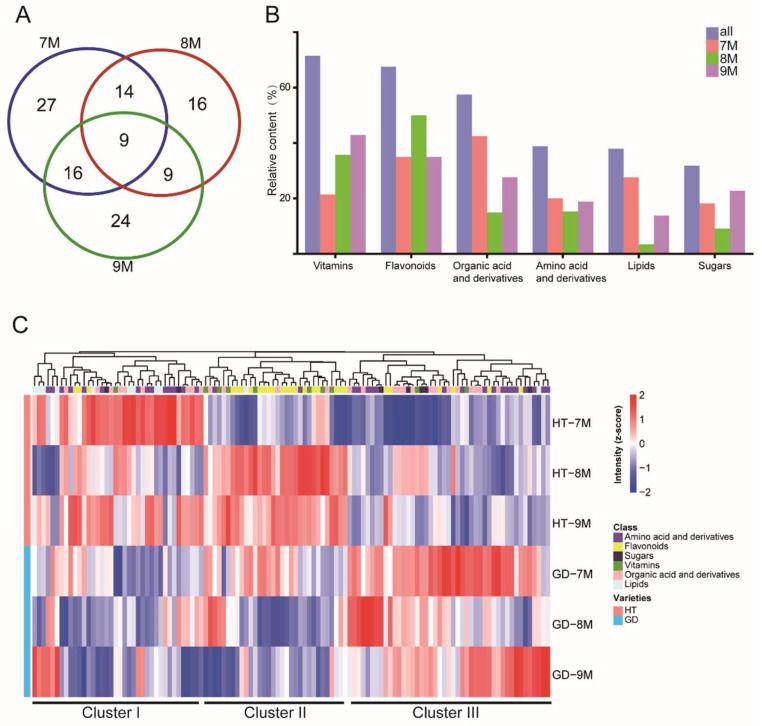
Figure 4.
Differential accumulation metabolite analysis. (A) Venn diagram shows the number of differentially accumulated metabolites among three growth stages. (B) Statistical analysis of differentially accumulated metabolites in different metabolite classes. (C) The levels of nonvolatile of coconut flesh in two coconut varieties over three growth stages are shown the heatmaps. Hierarchical cluster analysis of differentially accumulated metabolites. Each column in the figure represents a metabolite, each row represents either GD or HT coconut varieties at three different growth stages.

