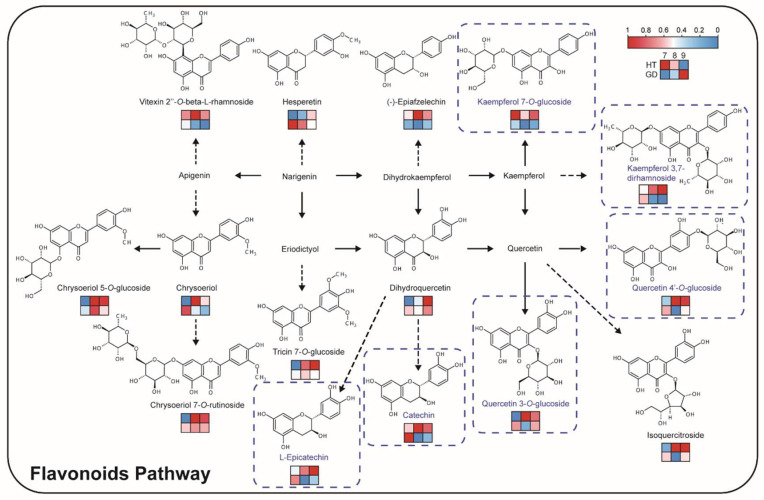
Figure 5.
Flavonoid biosynthesis pathway in the coconut flesh. The heatmaps are drawn according to the relative content of metabolites, and the contents of each metabolite are normalized. Columns and rows in the heatmap represent stages and varieties, respectively. In each heatmap, the upper row represents HT, the lower row represents GD. In the columns of each heatmap, 7M, 8M and 9M are represented from left to right. The metabolites with blue frames have a bitter taste.

