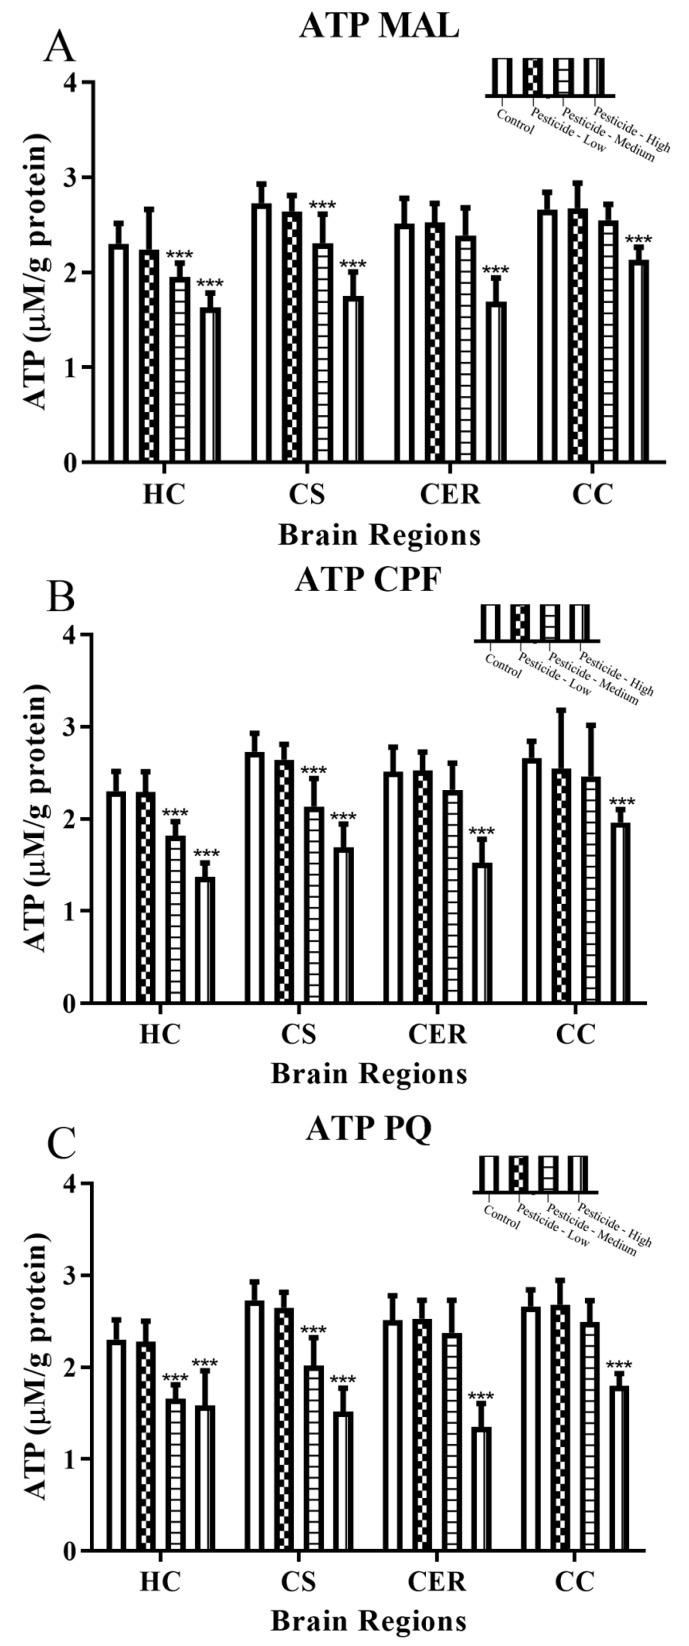
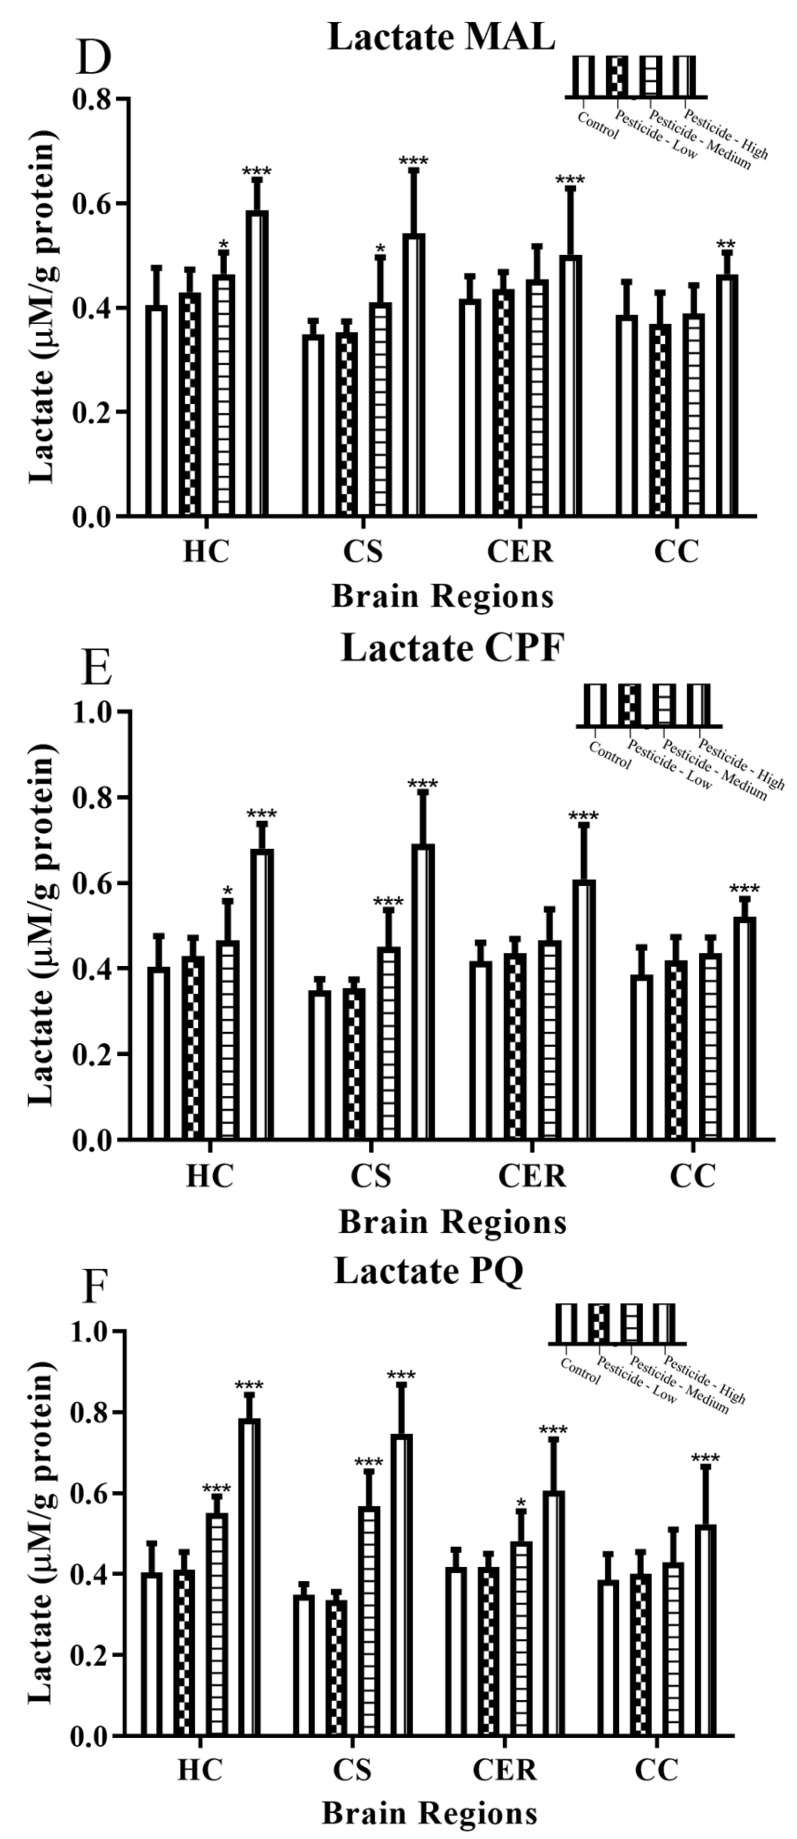
Figure 4.
Pesticide-induced inhibition of ATP levels and lactate production. Rats were dosed with malathion (MAL) (A,D); chlorpyrifos (CPF) (B,E); or paraquat (PQ) (C,F) at low, medium, or high dosages and the levels of cellular ATP and lactate quantified within the hippocampus (HC), corpus striatum (CS), cerebellum (CER), and cerebral cortex (CC). Histograms are representative of mean values with SDs, with significant changes marked with asterisks, according to * p < 0.05, ** p < 0.01, and *** p < 0.001.


