Figure 4.
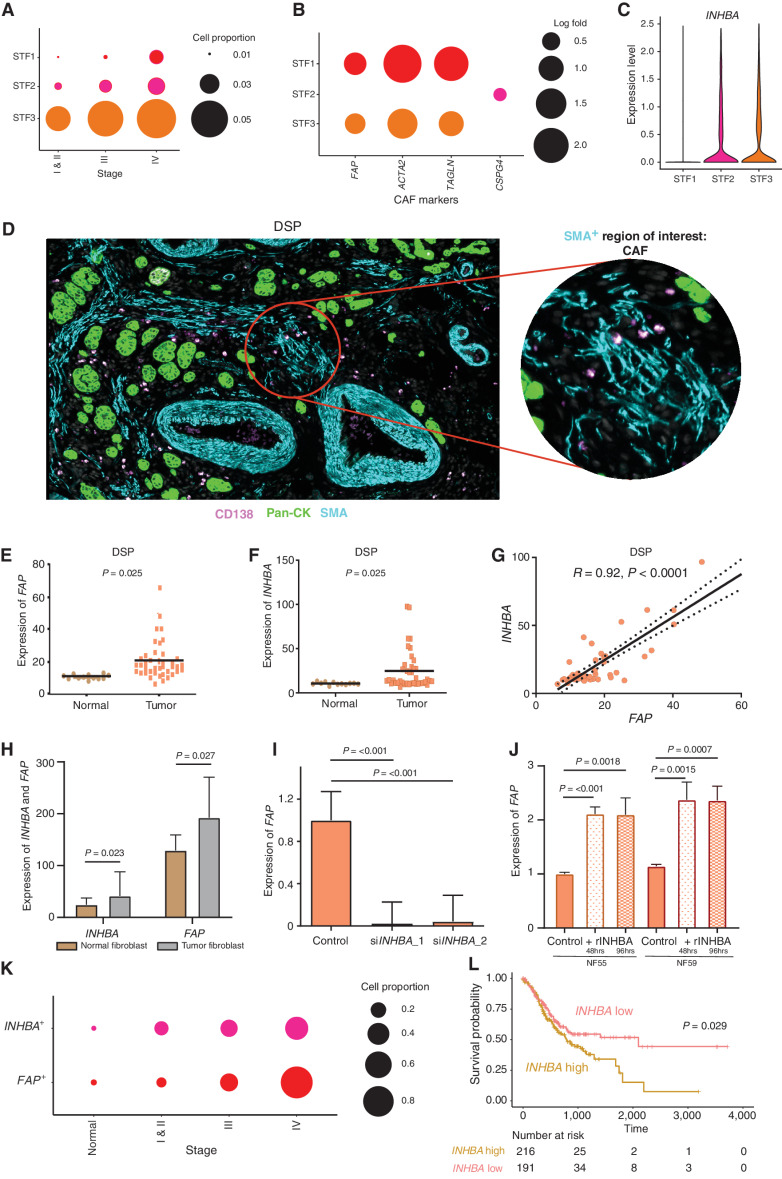
scRNA-seq enables identification of distinct gastric cancer fibroblast subtypes and INHBA–FAP axis as a CAF regulator. A, Bubble plots demonstrating stage-dependent increases in the proportion of fibroblast cells with STF3 being the dominant subcluster. The size of the circle represents the proportion of cells expressing subcluster-specific genes. B, Bubble plots showing fibroblast subclusters (STF1–3) expressing distinct CAF canonical markers (FAP, CSPG4, ACTA2, and TAGLN). The size of the circle represents the proportion of cells expressing different genes. C, Violin plot showing the expression of INHBA in STF2 and STF3 fibroblast clusters with negligible expression in the STF1 fibroblast cluster. D, Fibroblast ROIs captured by DSP analysis based on immunofluorescence staining for Pan-CK (epithelial, green), CD138 (plasma, pink), SMA (fibroblast, cyan), and DAPI (blue). The circular ROI is 300 μm in diameter. E, Bee swarm plot showing differential expression of FAP in fibroblast ROIs of normal and tumor samples by DSP (n = 13). F, Bee swarm plot showing differential expression of INHBA in fibroblast ROIs of normal and tumor samples by DSP (n = 13). G, Pearson correlation graph demonstrating strong positive correlations between INHBA and FAP gene expression in fibroblast ROIs using DSP. H, Bar graph showing significant expression of FAP and INHBA genes in flow-sorted tumor fibroblasts compared with matched normal fibroblasts (n = 10 each). I, Bar graph showing significant reduction in FAP gene expression after siRNA-mediated INHBA knockdown in tumor fibroblast lines. Two independent siRNAs were used. J, Bar graph showing significant increases in FAP gene expression in two normal fibroblast lines after treatment with recombinant INHBA (rINHBA) for 48 and 96 hours, respectively. K, Bubble plot depicting stage-dependent increases of FAP+ and INHBA+ cells in fibroblast cluster STF3 (P = 0.041). The circle sizes represent the relative proportion of cells expressing these genes. P values were computed using Kendall's τ method. L, Kaplan–Meier survival curves of TCGA-STAD data showing significant differences in overall survival between INHBA-high and INHBA-low samples. P values were computed using log-rank tests.

