Figure 5.
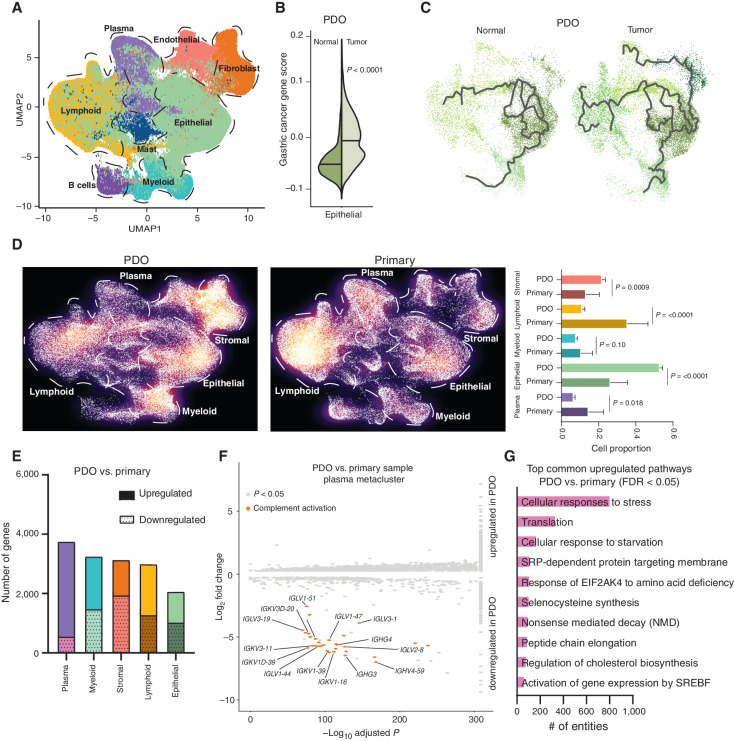
Comparative analysis of primary and organoid samples. A, UMAP representation of approximately 200,000 cells (∼48,000 cells from tumor PDOs with matched normal PDOs, combined with primary samples; ∼152,000 cells) recapitulating the major five metaclusters color-coded by their cell types. Each dot in the UMAP represents a single cell. B, Violin plot showing the expression of gastric cancer gene module scores in tumor PDOs compared with matched normal samples. C, Trajectory plot analysis of epithelial cells from tumor and normal PDOs demonstrating the expression of cellular differentiation gene programs in tumor PDOs depicted by long multiple branches. D, Density plot of UMAP representation comparing PDO and primary gastric samples demonstrating enrichment of lymphoid and plasma metaclusters in primary samples compared with PDOs. E, Graph showing the number of upregulated and downregulated genes in PDOs versus primary samples in the five metaclusters. The plasma meta-cluster shows the highest number of differentially expressed genes as compared with other metaclusters. F, Volcano plot of upregulated and downregulated genes in the plasma metacluster between PDOs and primary samples, showing significant downregulation of antibody-mediated complement factor genes in PDOs. x-axis shows the −log10 adjusted P value and y-axis log2 fold change in gene expression. G, Top common upregulated pathways in PDOs versus primary samples across all metaclusters.

