. 2022 Jan 14;12(4):1070–1087. doi: 10.1158/2159-8290.CD-21-0808

Figure 2.

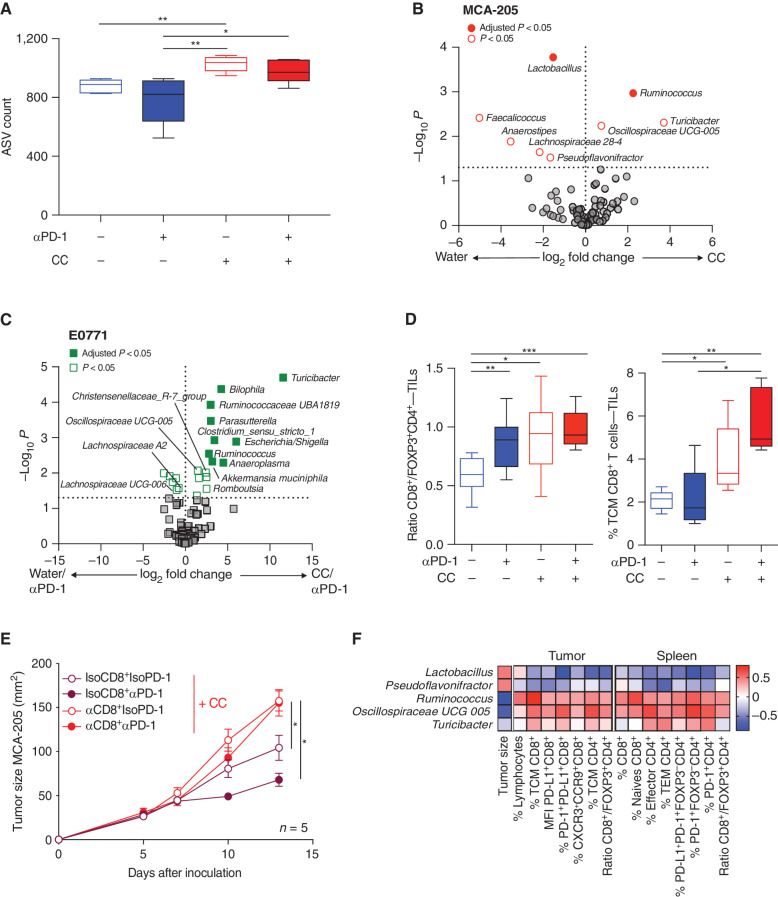
Figure 2. Impact of CC on microbiome composition and association with CD8+ T-cell antitumor activity. A, 16S rRNA analysis of the fecal samples from mice from the four groups in the MCA-205 experiments, and representation of the alpha diversity measured by the amplicon sequence variant (ASV) count in each group. B and C, Volcano plot representation of differential abundance analysis comparing (B) pooled CC vs. water (αPD-1 and IsoPD-1) groups in the MCA-205 model and (C) the water/αPD-1 vs. CC/αPD-1 groups in the E0771 model (n = 10 and 5 mice/group, respectively). Bacteria enriched in each group are represented using adjusted P value (fill shape symbol) and P value (no fill shape symbol; false discovery rate: 0.05). D, Flow cytometry analysis of the ratio of CD8+/FOXP3+CD4+ T cells and CD8+ T central memory (TCM) cell (CD45RB−CD62L+) subpopulations in MCA-205 TILs in the four experimental groups (n = 10 mice/group). E, Effects of anti-CD8 (αCD8) depletion or its isotype control (IsoCD8) on MCA-205 tumor growth kinetics with daily oral gavage of CC (n = 5 mice/group) treated or not with αPD-1 or its isotype control. F, Pairwise Spearman rank correlation heat map between significantly different bacteria enriched in CC/IsoPD-1 vs. water/IsoPD-1 groups with positively correlated TILs or splenocyte cytometry and matching tumor size in the MCA-205 experiment. MFI, mean fluorescence intensity; TEM, T effector memory. *, P < 0.05; **, P < 0.01; ***, P < 0.001.

Impact of CC on microbiome composition and association with CD8+ T-cell antitumor activity. A, 16S rRNA analysis of the fecal samples from mice from the four groups in the MCA-205 experiments, and representation of the alpha diversity measured by the amplicon sequence variant (ASV) count in each group. B and C, Volcano plot representation of differential abundance analysis comparing (B) pooled CC vs. water (αPD-1 and IsoPD-1) groups in the MCA-205 model and (C) the water/αPD-1 vs. CC/αPD-1 groups in the E0771 model (n = 10 and 5 mice/group, respectively). Bacteria enriched in each group are represented using adjusted P value (fill shape symbol) and P value (no fill shape symbol; false discovery rate: 0.05). D, Flow cytometry analysis of the ratio of CD8+/FOXP3+CD4+ T cells and CD8+ T central memory (TCM) cell (CD45RBCD62L+) subpopulations in MCA-205 TILs in the four experimental groups (n = 10 mice/group). E, Effects of anti-CD8 (αCD8) depletion or its isotype control (IsoCD8) on MCA-205 tumor growth kinetics with daily oral gavage of CC (n = 5 mice/group) treated or not with αPD-1 or its isotype control. F, Pairwise Spearman rank correlation heat map between significantly different bacteria enriched in CC/IsoPD-1 vs. water/IsoPD-1 groups with positively correlated TILs or splenocyte cytometry and matching tumor size in the MCA-205 experiment. MFI, mean fluorescence intensity; TEM, T effector memory. *, P < 0.05; **, P < 0.01; ***, P < 0.001.