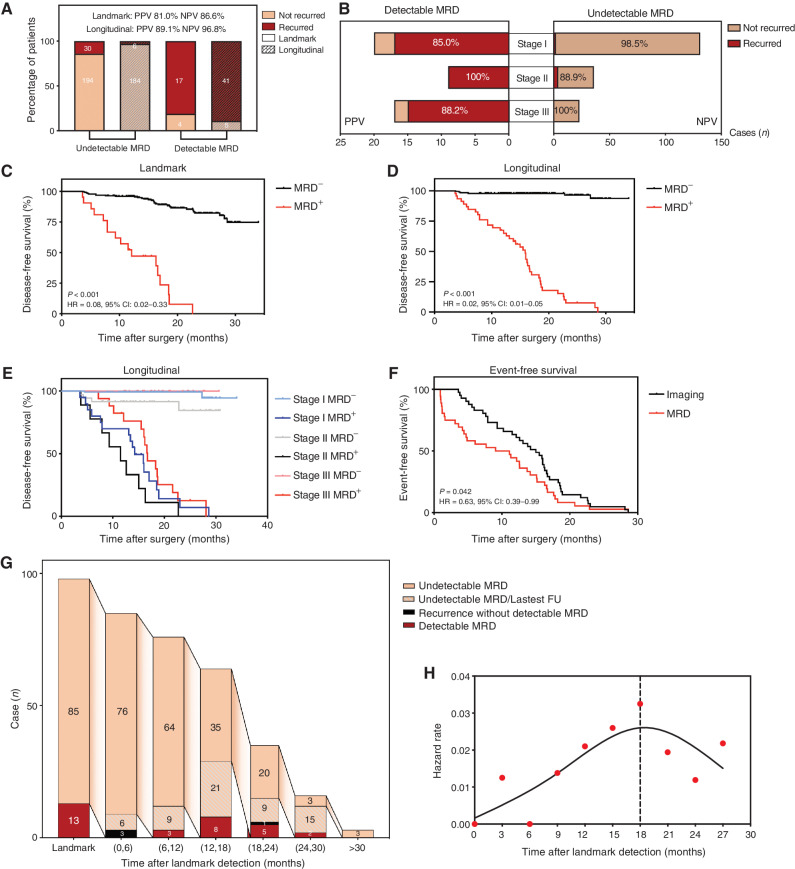
Figure 3.
MRD monitoring after surgery. A, The NPV and PPV of undetectable and detectable MRD at landmark and longitudinal time points, respectively. B, NPV and PPV of undetectable and detectable MRD at longitudinal time points across different stages. C, Kaplan–Meier analysis of DFS stratified by landmark MRD status: detectable (n = 21) versus undetectable (n = 224). D, Kaplan–Meier analysis of DFS stratified by longitudinal MRD status: detectable (n = 46) versus undetectable (n = 190). E, Kaplan–Meier analysis of DFS stratified by longitudinal MRD status across different stages. F, Kaplan–Meier analysis of time to MRD detection and time to imaging recurrence from the end of treatment for all patients. G, Flowchart of occurrence time of MRD or recurrent events in stage II/III patients; the peak timeframe of detectable MRD occurrence was 12 to 18 months after surgery. H, Estimated hazard rate curves for event occurrences in stage II/III patients with landmark-undetectable MRD (n = 85, events were defined as detectable MRD or disease recurrence).

