. 2022 May 11;12(7):1690–1701. doi: 10.1158/2159-8290.CD-21-1486

Figure 5.

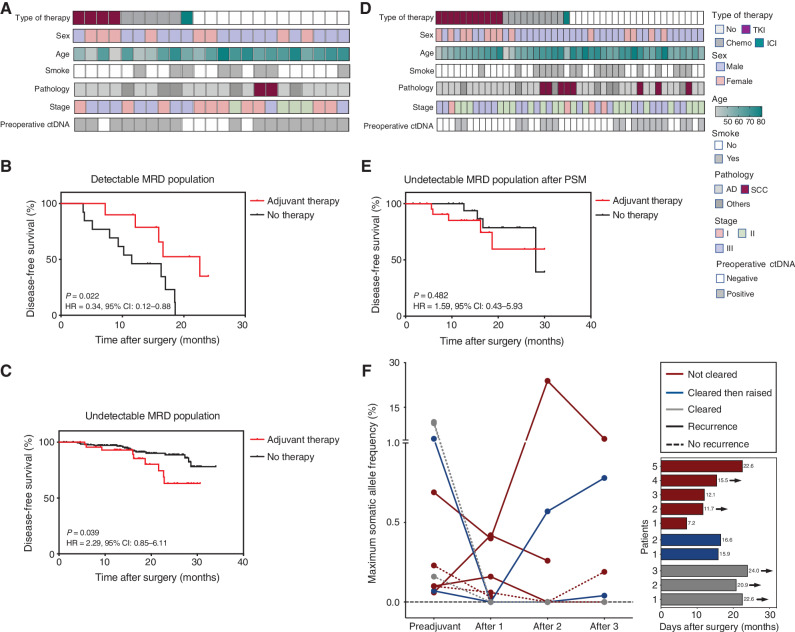
Figure 5. MRD predictive value on adjuvant therapy. A, Heatmap plot based on baseline characteristics of patients with detectable MRD at preadjuvant and landmark timepoints (n = 23). B, Kaplan–Meier analysis of DFS stratified by adjuvant therapy for patients with detectable MRD at preadjuvant and landmark timepoints: with adjuvant therapy (n = 10) versus without (n = 13). C, Kaplan–Meier analysis of DFS stratified by adjuvant therapy for patients with undetectable MRD at preadjuvant and landmark timepoints: with adjuvant therapy (n = 44) versus without (n = 182). D, Heatmap plot based on baseline characteristics of patients with undetectable MRD at preadjuvant and landmark timepoints after propensity score matching (PSM). E, After PSM, Kaplan–Meier analysis of DFS stratified by adjuvant therapy for patients with undetectable MRD at preadjuvant and landmark timepoints: with adjuvant therapy (n = 22) versus without (n = 22). F, Dynamic changes of ctDNA frequency before and after adjuvant therapy for patients with detectable MRD (n = 10), and the DFS of these patients. The arrow represents five of them still maintained disease-free status. TKI, tyrosine kinase inhibitor; Chemo, chemotherapy; ICI, immune-checkpoint inhibitor; AD, adenocarcinoma; SCC, squamous cell carcinoma; DFS, disease-free survival.

MRD predictive value on adjuvant therapy. A, Heat map plot based on baseline characteristics of patients with detectable MRD at preadjuvant and landmark time points (n = 23). B, Kaplan–Meier analysis of DFS stratified by adjuvant therapy for patients with detectable MRD at preadjuvant and landmark time points: with adjuvant therapy (n = 10) versus without (n = 13). C, Kaplan–Meier analysis of DFS stratified by adjuvant therapy for patients with undetectable MRD at preadjuvant and landmark time points: with adjuvant therapy (n = 45) versus without (n = 182). D, Heat map plot based on baseline characteristics of patients with undetectable MRD at preadjuvant and landmark time points after propensity score matching (PSM). E, After PSM, Kaplan–Meier analysis of DFS stratified by adjuvant therapy for patients with undetectable MRD at preadjuvant and landmark time points: with adjuvant therapy (n = 22) versus without (n = 22). F, Dynamic changes of ctDNA frequency before and after adjuvant therapy for patients with detectable MRD (n = 10), and the DFS of these patients. The arrow represents five of them who still maintained disease-free status. AD, adenocarcinoma; Chemo, chemotherapy; SCC, squamous cell carcinoma; TKI, tyrosine kinase inhibitor.