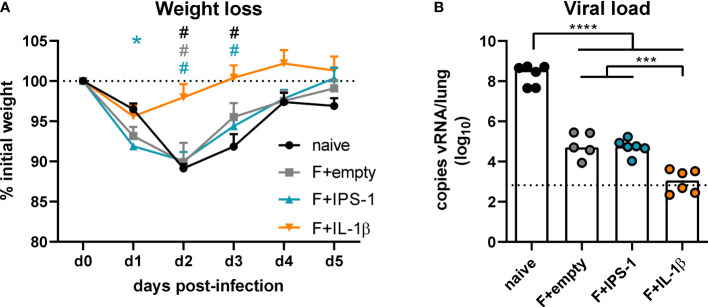
Figure 3.
Vaccine efficacy against RSV infection. Mice were experimentally infected with 1x10⁶ PFU RSV-A2 48 days after the immunization. (A) The initial weight was set as 100% (dotted line) and weight changes were monitored for five days. (B) Viral RNA copies were quantified by qRT-PCR in lung homogenates five days post-infection. The dotted line represents the lower limit of quantification. Data represent group means with SEM (A) or group medians overlaid with individual data points (B). n=5-6. Data were analyzed by one-way ANOVA followed by Tukey´s post test (values in B were log-transformed before analysis). For (A): *p<0.05 vs. naive, # p<0.05 vs. F+IL-1β. For (B): *p<0.05, ** p<0.005, *** p<0.0005, **** p<0.0001.

