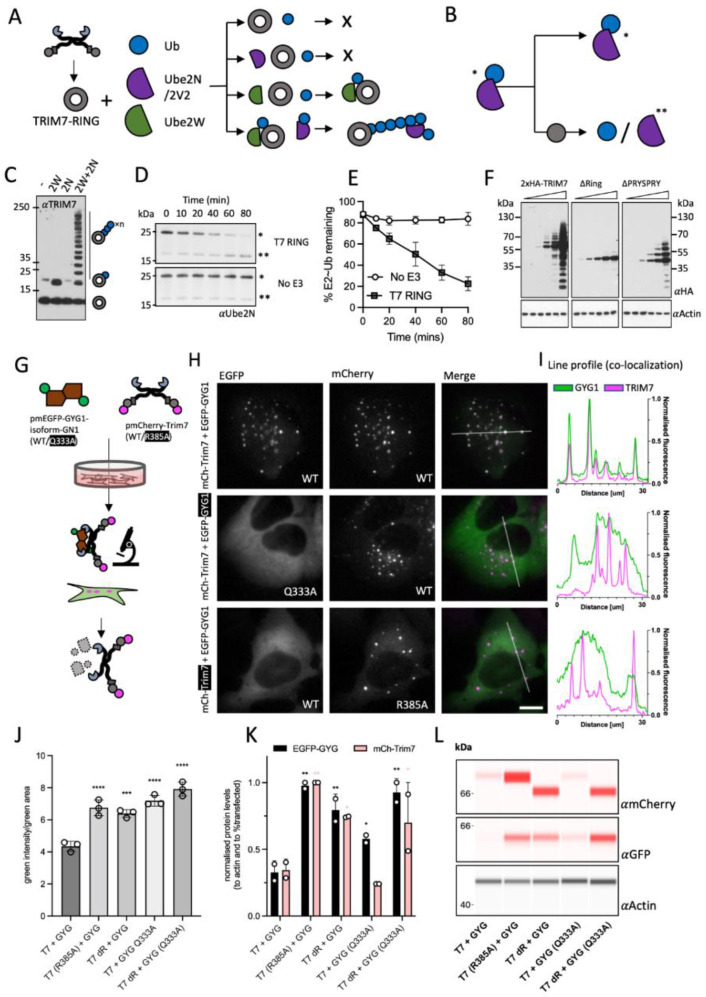
Figure 3.
TRIM7 co-localizes with helix-ΦQ containing substrates inside cells and degrades them. (A–E) Schematic representation of in vitro ubiquitination experiments. (A) TRIM7-RING (grey circle) was mixed with combinations of Ubiquitin (Ub, blue circle), Ube2N/Ube2V2 (purple semi-circle) and Ube2W (green teardrop) as shown and the reactions followed by immunoblotting (C) with an anti-TRIM7 antibody. A representative blot from at least three independent experiments is shown. (B) E2 discharge experiment: Ube2N~Ub complex was incubated with TRIM7-RING, and the reaction followed over time as indicated in (D). Blots were probed with anti-ubiquitin antibody. A single asterisk denotes the charged Ube2N~Ub, whereas a double asterisk denotes the uncharged Ube2N. A representative blot from at least three independent experiments is shown. (E) Densitometry quantification of band intensities from 3D was plotted to show the kinetics of E2-Ub discharge. Error bars in all graphs depict the mean +/− SEM. Data represent three independent replicates. (F) Western blots from cells overexpressing indicated constructs of epitope-tagged TRIM7 (probed with anti-HA antibody). Ubiquitin-laddering is lost when the RING domain is deleted. A representative blot from two independent experiments is shown. (G) Schematic overview of the experiments presented in (H). EGFP-GYG1 is represented as a green-brown shape. TRIM7 is shown as usual but with N-terminal mCherry (magenta circle). Plasmids were co-expressed, and the fluorescence monitored using live imaging and the protein levels quantified using either the fluorescence intensity or using cell lysates. (H) Live-cell microscopy of U2OS cells expressing mCherry-TRIM7 and EGFP-GYG1 constructs. Left column shows the EGFP signal (green), middle column shows the mCherry signal (magenta) and the right column shows the false-colored merged image (EGFP—green; mCherry—magenta; merge—white). The scale is the same in all images, and the bar represents 10 µm. Rows represent different conditions: Top is both WT sequences. Middle has a Q333A mutation in the EGFP-GYG1 construct. Bottom has the R385A mutation in the mCh-TRIM7 con-struct. Example images are shown from at least two independent experiments. (I) Line profile analysis (ImageJ) of the fluorescent signal. Green trace shows the EGFP signal whilst the magenta trace shows the mCherry signal. The line used in the analysis is shown on the merged signal images. (J) Fluorescence-based quantification (using the IncuCyte) of EGFP-GYG1 protein levels, graph shows the total integrated intensity of the EGFP signal divided by the EGFP area from three biological replicates. ANOVA was used for statistical analysis and significant differences from T7 + GYG condition indicated (p < 0.0005 (***), p < 0.0001 (****)). (K,L) Protein quantification and blots using cell lysates and capillary-based Western Blot (Jess). Values from two biological replicates were normalized to loading control (actin) and the fraction of cells transfected (see methods). ANOVA was used for statistical analysis and significant differences from T7 + GYG condition indicated (p < 0.05 (*), p < 0.005 (**)). Black asterisks indicate significance in EGFP-GYG expression and pink asterisks in mCh-TRIM7 expression.

