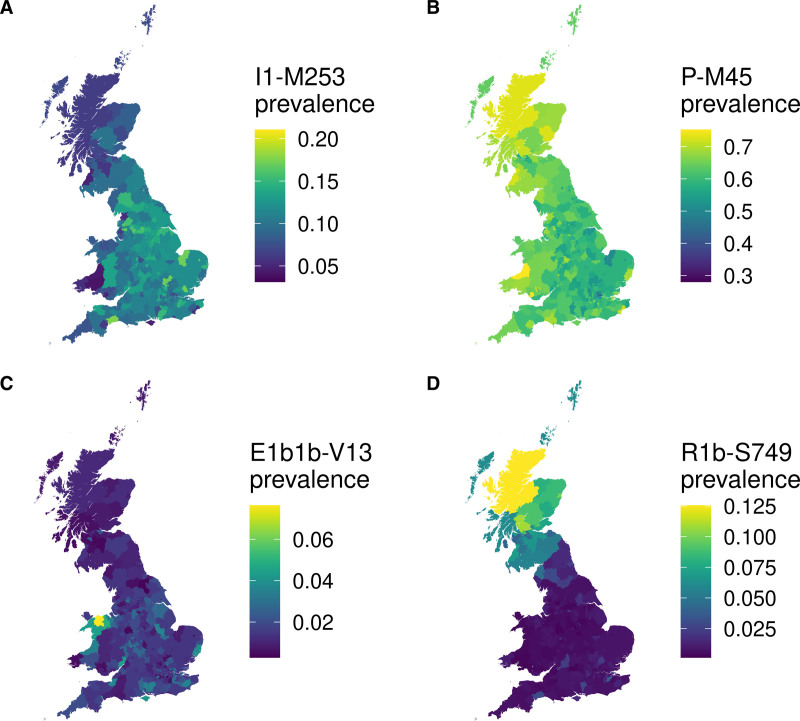
Figure 1.
Examples of geographic structuring of Y chromosome variation by place of birth of genetically British men from UK Biobank. The prevalence of male-specific region of the Y chromosome haplogroups was plotted by place of birth in successively larger areas with at least 100 individuals, from wards and electoral divisions, to local authorities, to regions of England and the nations of Great Britain. Displayed are examples with pronounced structuring (A) I1-M253 (B) P-M45, (C) E1b1b-V13, (D) R1b-S749. Note the prevalence scales are different between haplogroups. See https://doi.org/10.7488/ds/3472 for maps of all 90 haplogroups.

