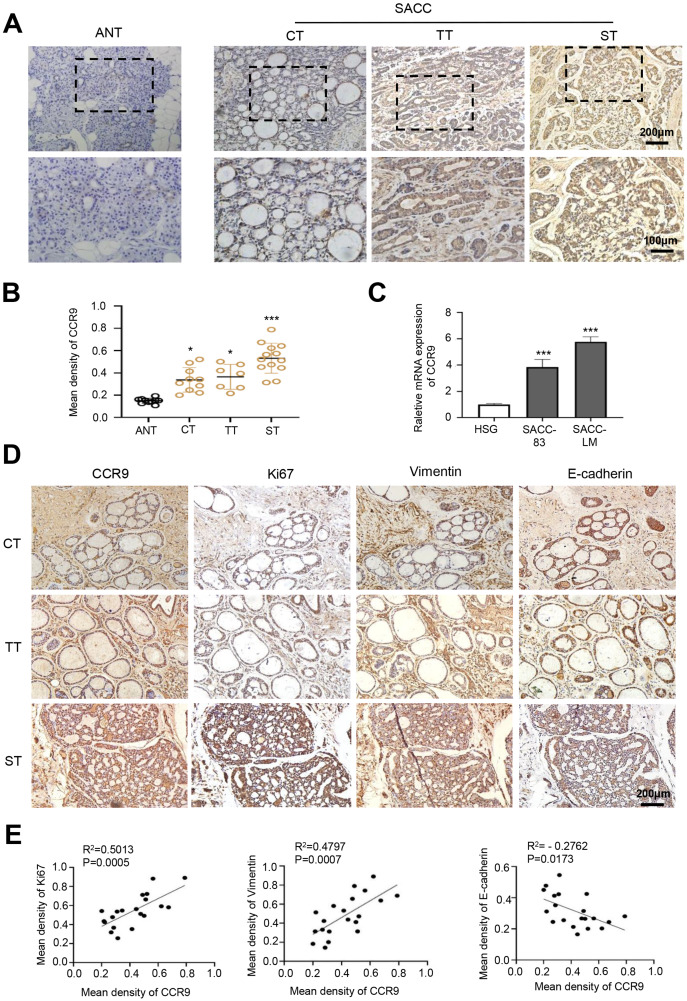
Figure 1. Expression of CCR9 in SACC and its correlation with tumor proliferation and metastasis.
(A) Representative images showing the expression of CCR9 in different types of SACC (cribriform type, CT, n = 10; tubular type, TT, n = 7; solid type, ST, n = 13) by IHC. Adjacent normal tissue (ANT, n = 10) was used as the control group. The boxed areas in the upper panels are shown at higher magnification in the lower panels. (B) The relative fold change in CCR9 expression (A) in SACC was quantitatively analyzed (unpaired two-tailed t-test, *P < 0.05, ***P < 0.001). (C) The mRNA expression of CCR9 was determined by RT–qPCR in the SACC-83, SACC-LM and HSG cell lines (n = 3, unpaired two-tailed t-test, ***P < 0.001). (D) Representative images of the expression of tumor proliferation and invasion markers (Ki67, vimentin, and E-cadherin) by IHC in the three types of SACC. (E) Pearson correlation analysis was used to analyze the expression of Ki67, vimentin, E-cadherin and CCR9 in SACC (n = 20, two‑tailed Pearson’s correlation). Data are presented as the mean ± SD.

