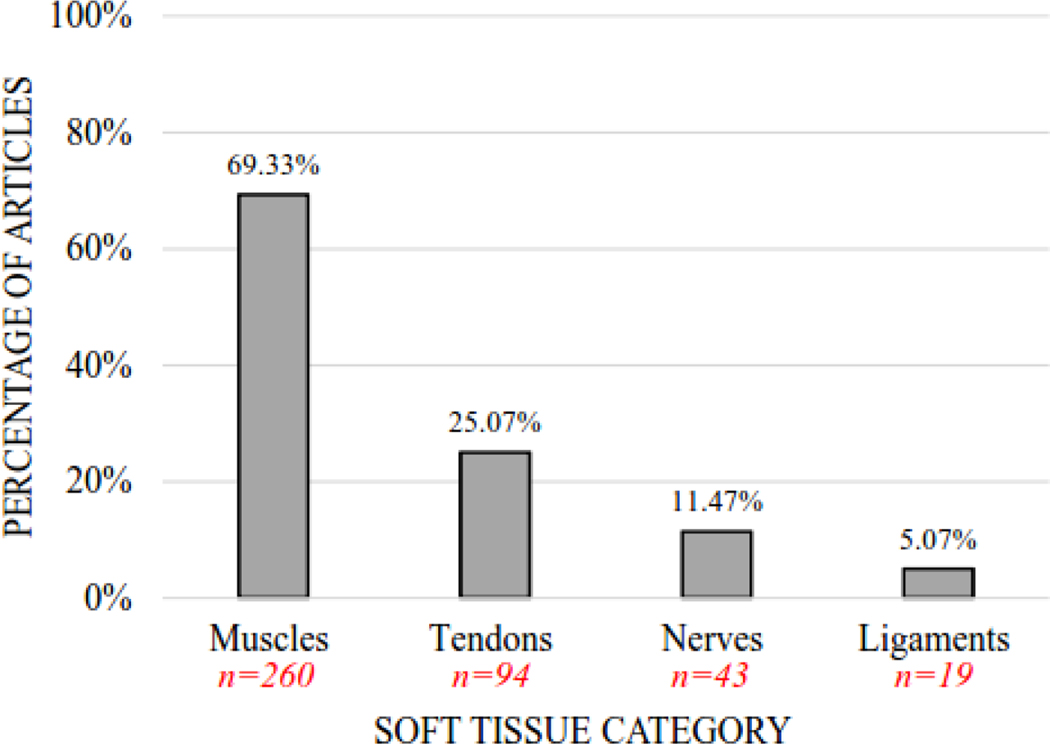
Figure 2.
Percentage of Articles by Soft Tissue Category. The vertical bar graph depicts the percentage of articles (n=375) that included muscles, tendons, nerves, and ligaments for shear wave elastography examination. Note: Some articles examined multiple soft tissue categories, accounting for overlap in the category percentages (i.e., exceeding 100%).

