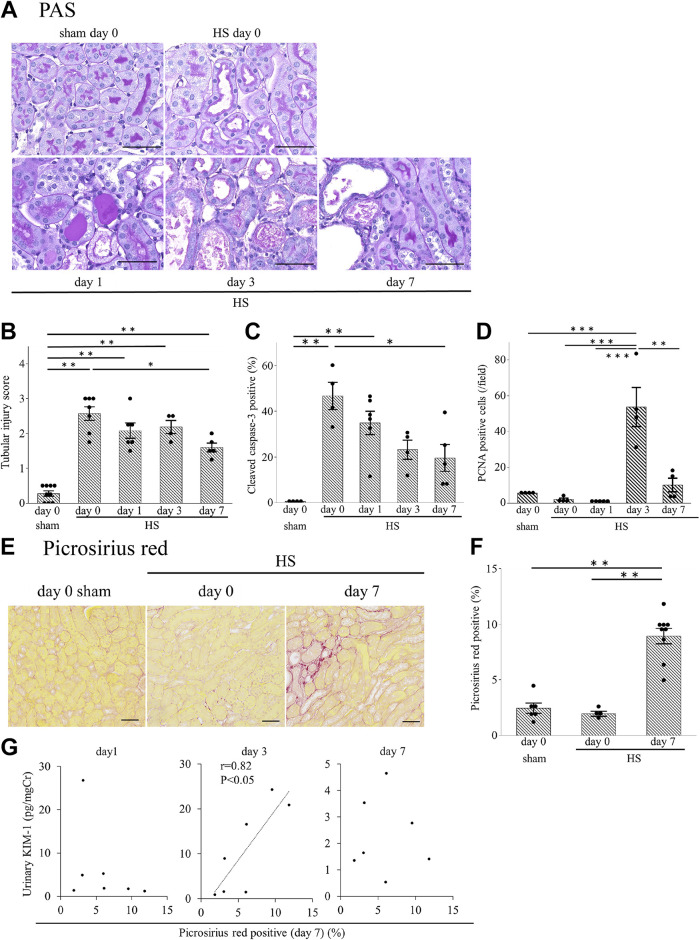
Figure 2.
Kidney histology after heat stress (HS). A: representative periodic acid-Schiff (PAS) staining in the mouse kidney (magnification: ×400). B: the tubular injury score in the HS group was higher than that in the sham group. Tubules positive for cleaved caspase-3 (C) and proliferating cell nuclear antigen (PCNA; D) were counted in four randomly selected fields at ×200 magnification. On days 0 and 1 after HS, the percentage of cleaved caspase-3-positive tubules in the HS group was significantly higher than in the sham group (C). PCNA expression in tubular cells tended to be reduced on day 1 but was increased on day 3 (D). E: renal fibrosis was evaluated with picrosirius red staining (magnification: ×200). F: the picrosirius red-positive area, as evaluated using ImageJ, was significantly higher on day 7 compared with day 0 in the HS group or day 0 in the sham group. G: the correlation between the picrosirius red-positive area on day 7 after HS and the urinary KIM-1 levels on days 1, 3, or 7 were examined (n = 7). Only urinary KIM-1 on day 3 had a significant positive correlation. Data represent means ± SE from 4 to 9 mice in each group. *P < 0.05; **P < 0.01; ***P < 0.001. Scale bars = 50 μm in A and E. Cr, creatinine.

