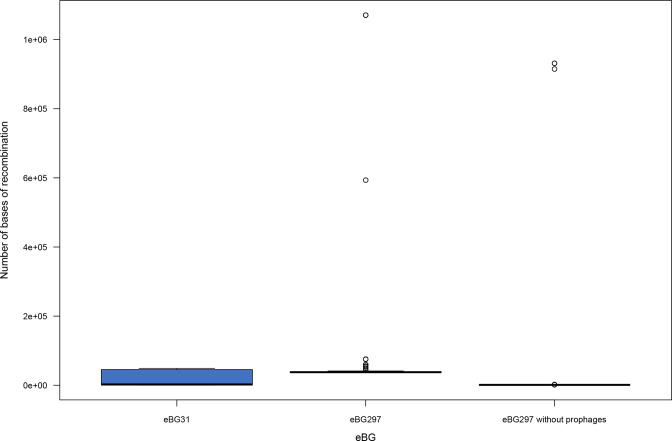
Fig. 2.
Distribution in the amount of recombination between eBGs in South Africa. Box and whisker plot of the number of bases of recombination in isolates from eBG31 (n=263), eBG297 (n=124) and eBG297 with prophages masked. Significantly more recombination was present in eBG297 isolates compared to eBG31 (P<0.003). This can be attributed to prophages in the eBG297 isolates as masking them significantly decreased the amount of recombination (P<2.2×10⁻¹⁶).

