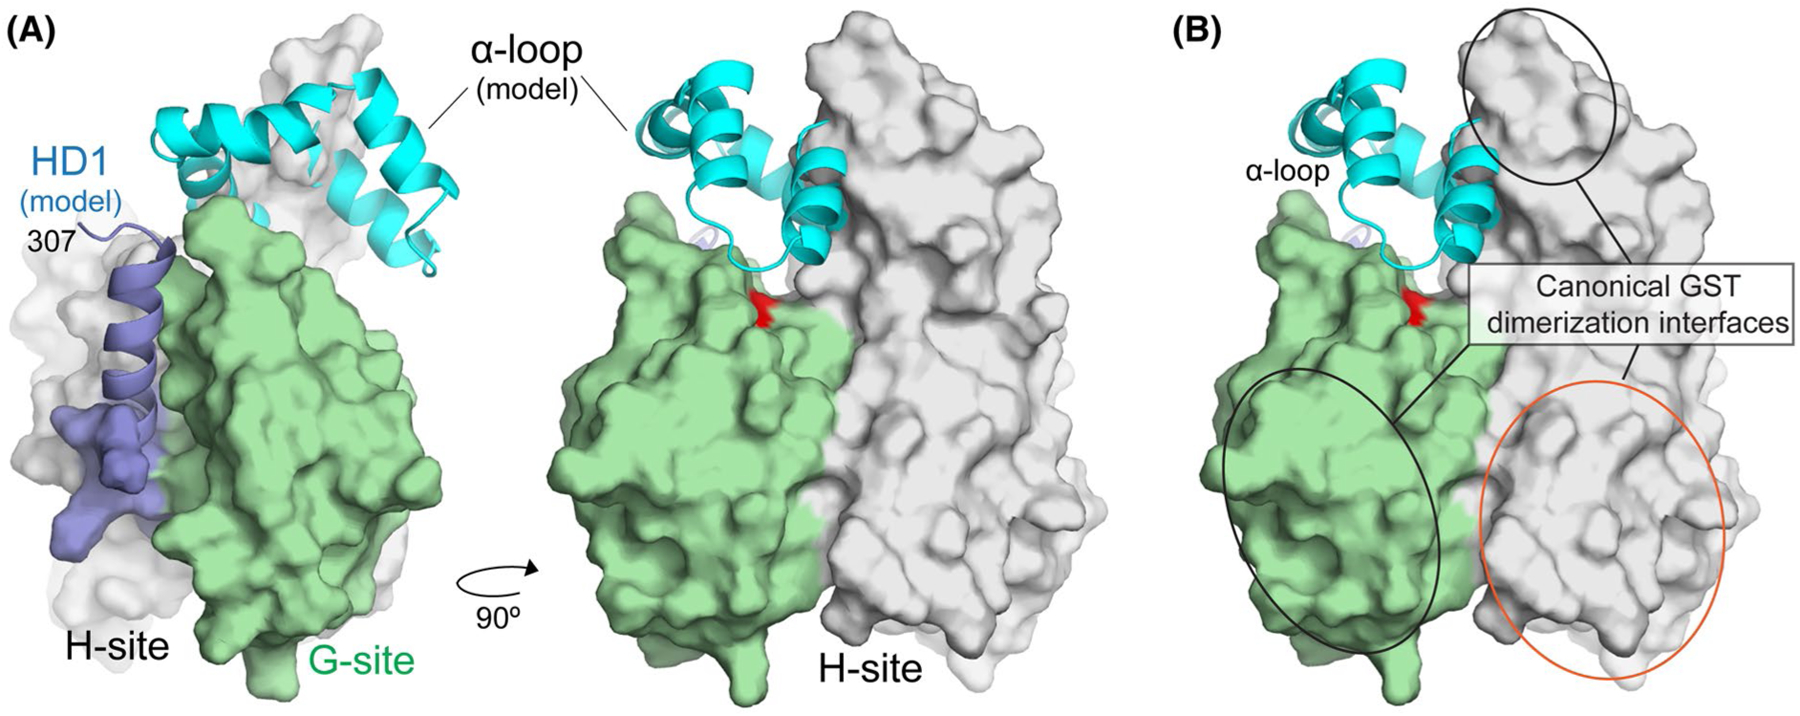
FIGURE 5.

Structural model for the cytoplasmic domain of GDAP1. A, Model for the location of the α-loop and the HD1 domain relative to the core. The experimentally derived GDAP1-core is shown as a molecular surface and colored as in Figure 3. The α-loop (cyan) and a portion of the HD1 (blue) were added from structural predictions generated by I-TASSER. B, Modeled α-loop and HD1 regions do not overlap with surfaces used by canonical GSTs to promote dimerization (red and black ovals)
