FIGURE 8.

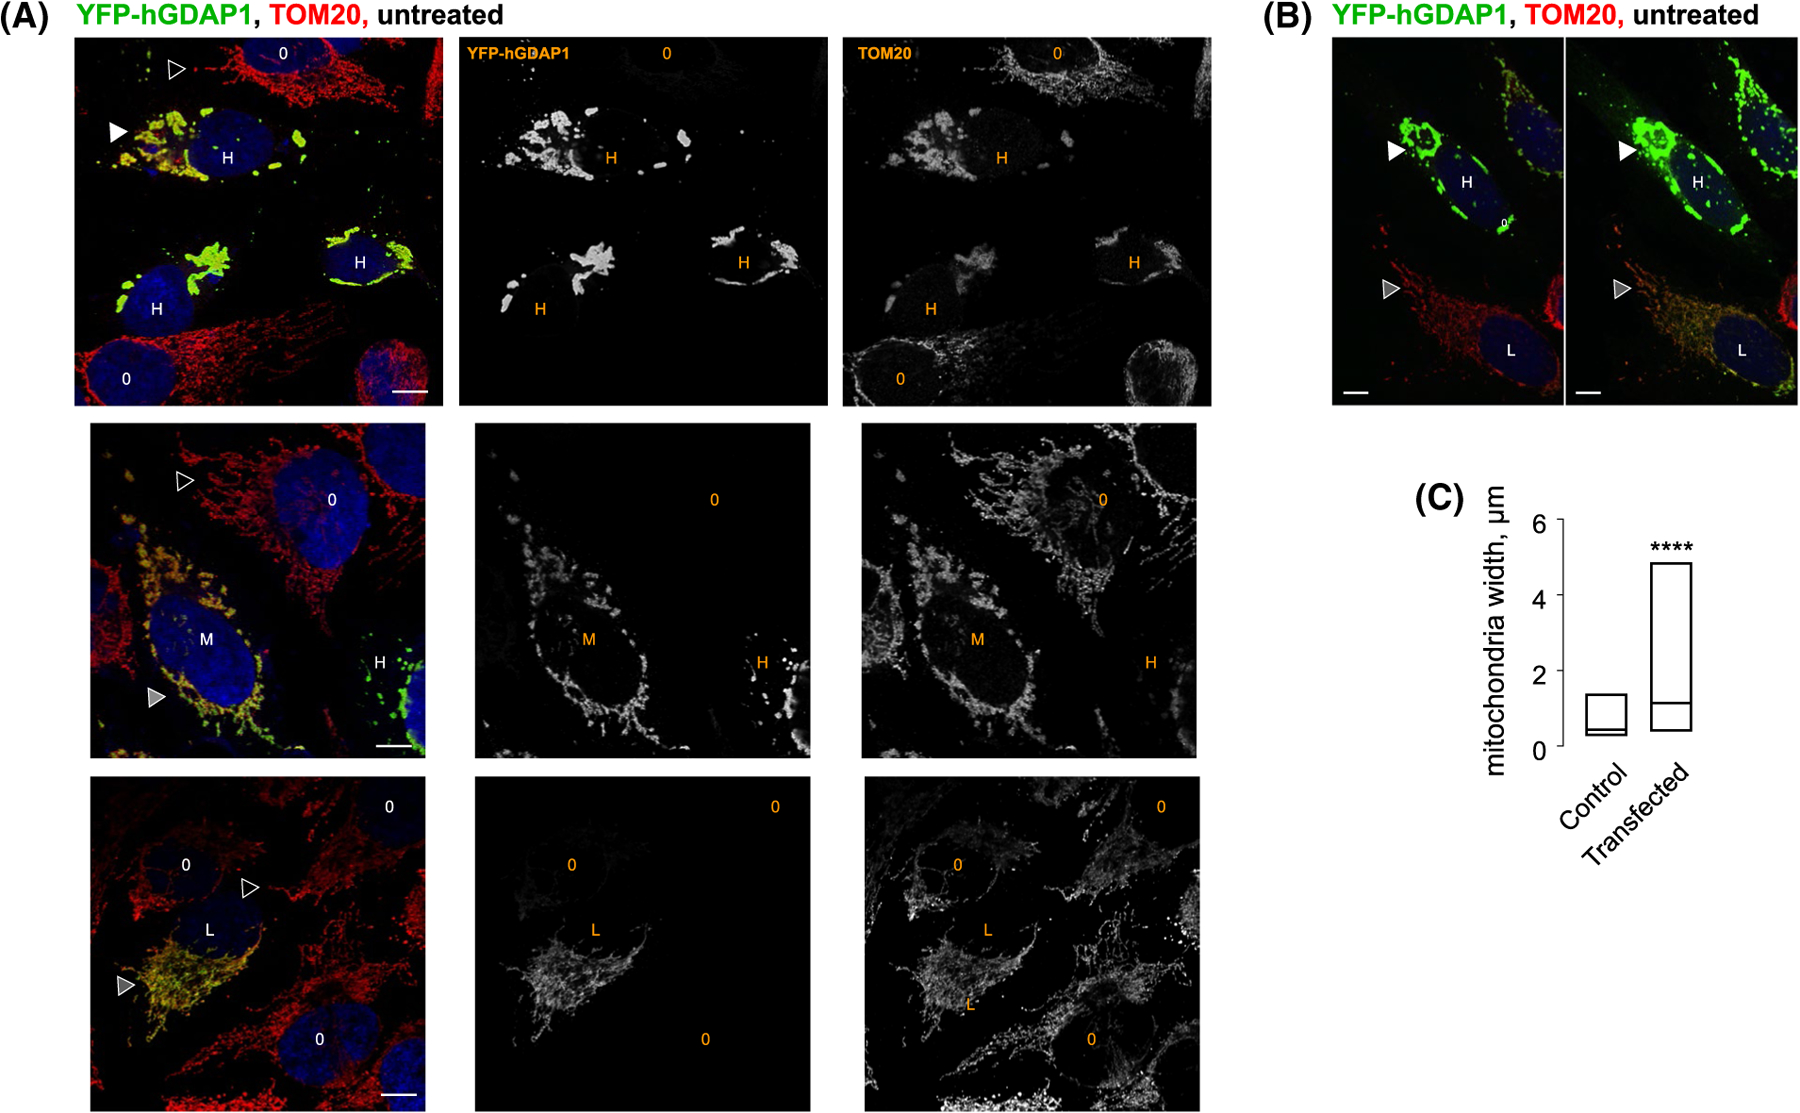
Overexpression of GDAP1 results in a distended mitochondrial morphology. A, Representative confocal images of HeLa cells transfected with YFP-GDAP1 fusion (full-length human GDAP1 containing the transmembrane domain, green) and stained with anti-TOM20 antibodies (red). Blue is DAPI. O identifies cells that were not transfected as evidenced by the lack of green signal from YFP-GDAP1. H, M and L represent highly, medium and low expressing cells. Hollow triangles point to normal tubular mitochondria. White triangles point to the distended mitochondria. Gray triangles point to intermediate and normal mitochondrial phenotypes in GDAP1-positive cells. B, Images representing the same field of view were taken at two different laser intensity and amplification gain to show the differences in GDAP1 expressing levels in GDAP1-positive cells with the distended and normal phenotypes. C, Box plot representing a triplicate set of images used for analysis. Data represent 153 particles for the control and 62 particles for the transfected set. **** is P < .0001 using unpaired two-tailed t-test. The size bar represents 10 μm
