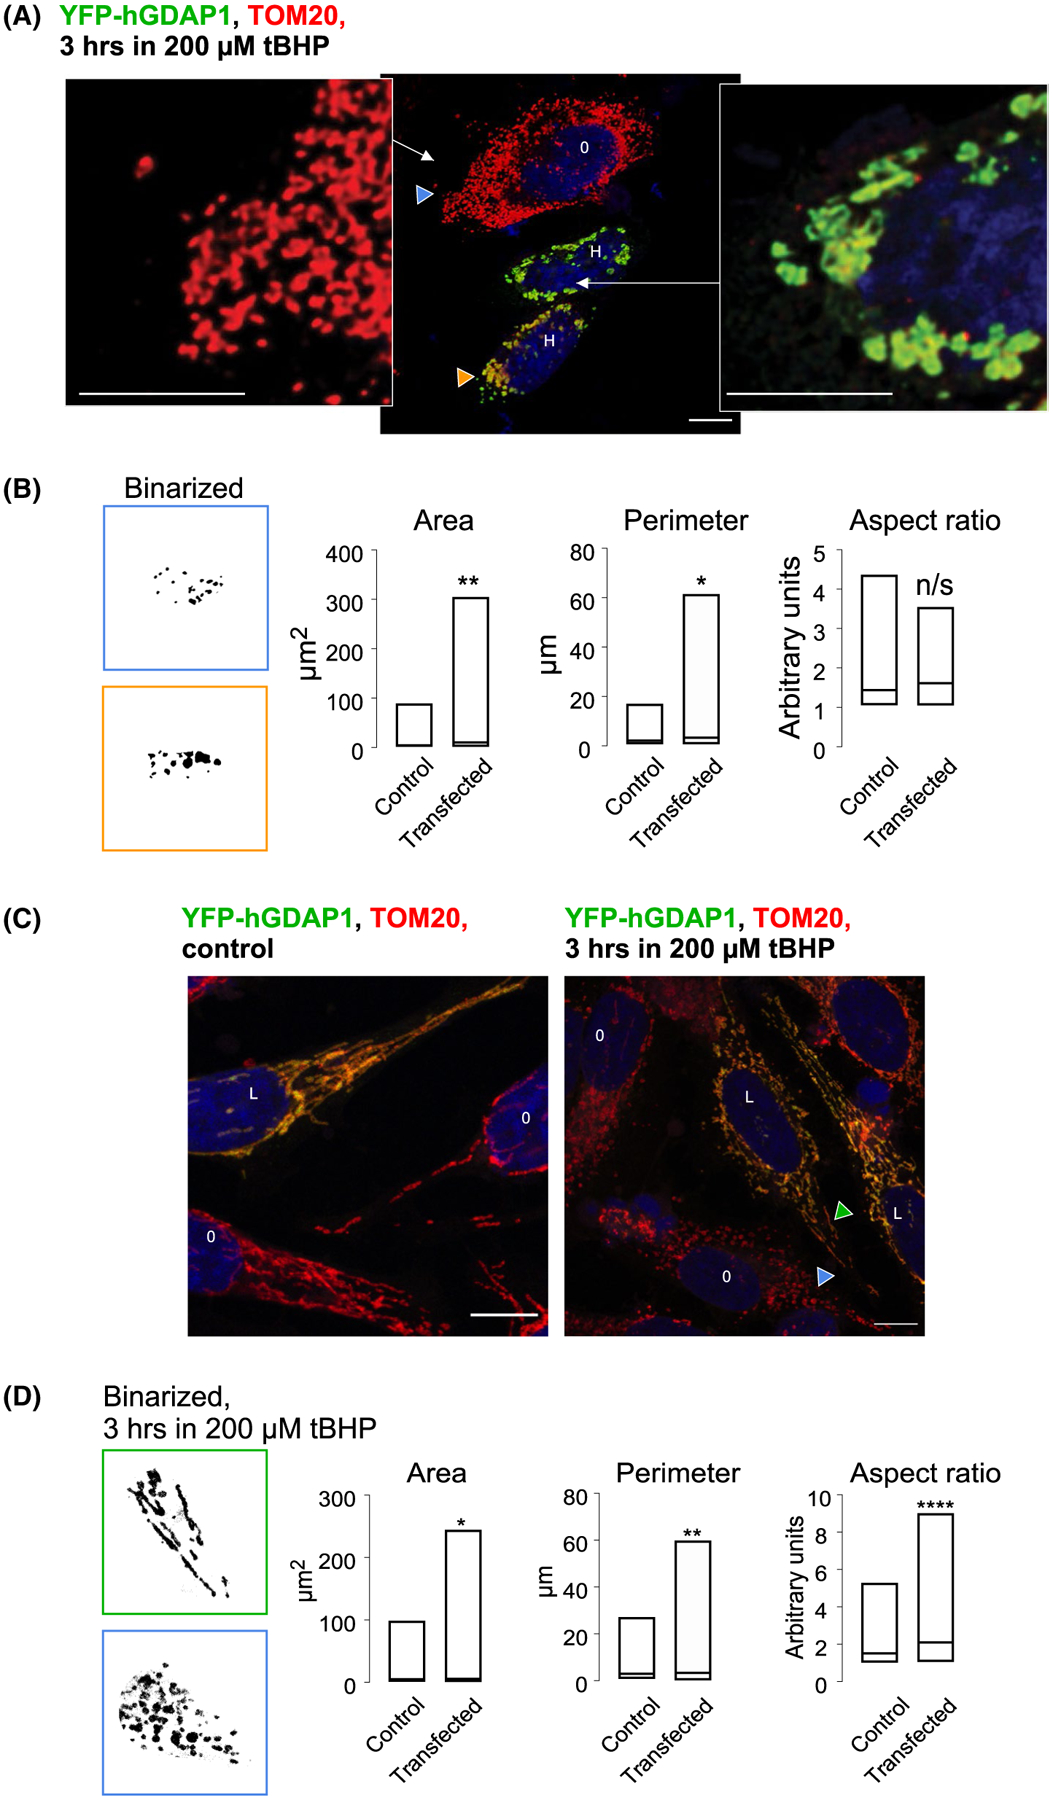
FIGURE 9.

Confocal analysis of mitochondrial morphology in control and GDAP1-overexpressing cells under oxidative stress. A, Mitochondrial fragmentation in control and overexpressing cells exposed to 200 μM tBHP for 3 hours. Zoom-out (middle) and zoom-in images represent control mitochondria (blue arrowheads) and mitochondria overexpressing full -length wild-type human GDAP1 containing the transmembrane domain (orange arrowheads). O represents control cells and H represents highly GDAP1-expressing cells. B, Binarized fragments of images containing the individual mitochondrial particles. Blue frame represents mitochondria from control and orange frame represents mitochondria from GDAP1-overexpressing cells. Box plot representing a triplicate set of images used for analysis. Data represent 126 particles for the control and 57 particles for the transfected set. * is P < .05 and ** is P < .005 using the unpaired two-tailed t-test. C, Protective effect of low GDAP1 expressing against mitochondrial fragmentation induced by oxidative stress. Confocal images. Blue arrowheads point to control mitochondria and green arrowheads point to mitochondria in the cell expressing low levels of recombinant GDAP1. O represents control cells and L represents low GDAP1-expressing cells. D, Binarized fragments of images containing individual mitochondrial particles from cells treated with 200 μM tBHP for 3 hours. Blue frame represents mitochondria from control and green frame represents mitochondria from GDAP1-overexpressing cells. Box plot representing a 5-image set used for analysis. Data represent 280 particles for the control and 325 particles for the transfected set. * is P < .05, ** is ** is P < .005 **** is P < .0001 using unpaired two-tailed t-test. The size bar represents 10 μm
