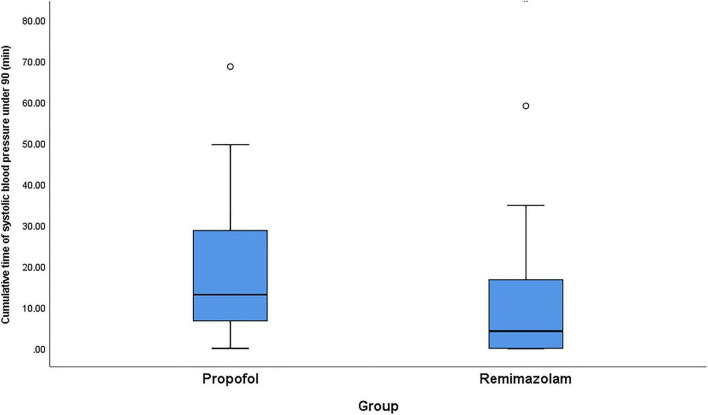
FIGURE 3.
Comparison of propofol and remimazolam on cumulative time of intraoperative hypotension. Boxplots are shown with the lines in the box representing median [Q1, Q3] of the observed cumulative time and the whiskers extended to the minimum at the bottom and the maximum on top. Q1 and Q3 represent 25th and 75th of the cumulative time of intraoperative hypotension.

