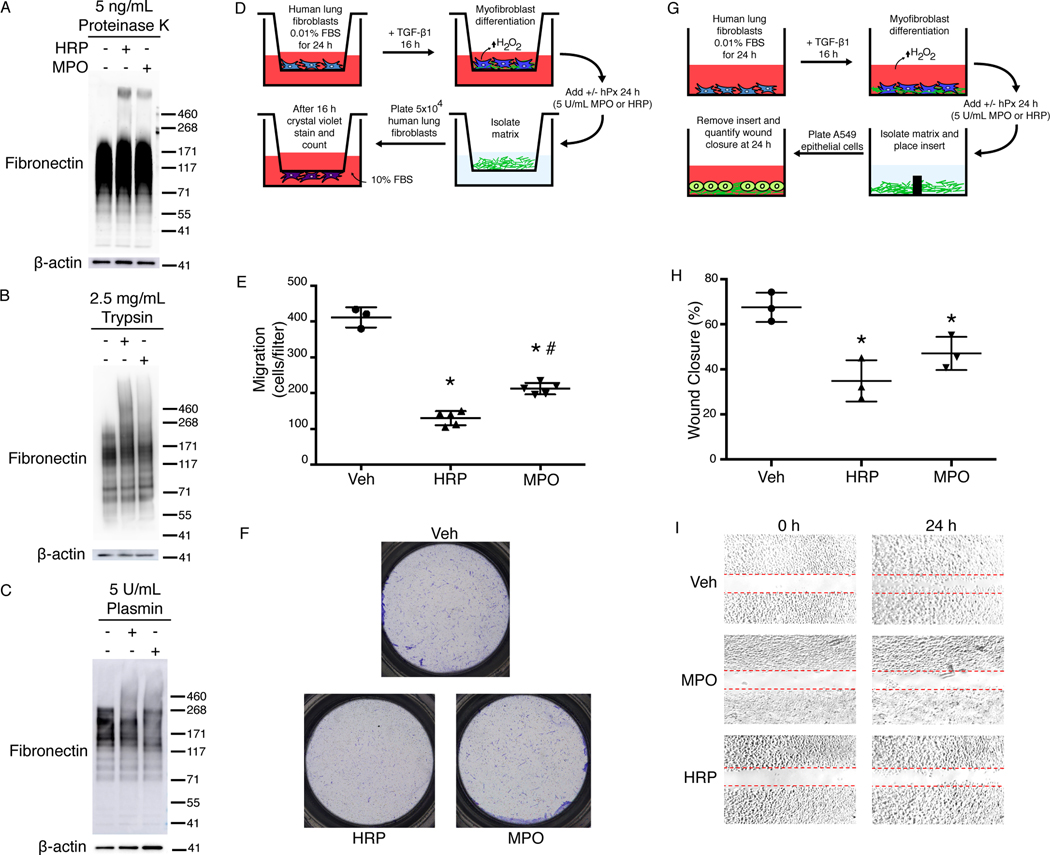
Fig. 4. Fibronectin o,o’-dityrosine crosslinking confers protease resistance and inhibits fibroblast and epithelial cell migration.
(A-C) Western blot analyses of fibronectin in lysates from human lung myofibroblasts treated with the indicated proteases. β-actin is a loading control. Data are representative of three independent experiments. The positions of molecular weight standards are indicated to the right of the blot. (D) Schematic of the experimental design of the transwell migration assay. Human lung fibroblasts in the upper chamber were treated with TGF-β1 to stimulate differentiation into myofibroblasts and H2O2 production. MPO or HRP (hPx) was added to stimulate oxidation of tyrosine residues, then the matrix was decellularized. Fibroblasts were then plated on the decellularized matrix and tested for migration through the matrix into the lower chamber. (E) Total number of fibroblasts that migrated to the bottom of the transwell. Data show mean ± SD; n = three independent experiments with 3–5 transwell inserts per experiment. * indicates significantly decreased fibroblast migration compared to vehicle control (Veh); # indicates significantly increased migration compared to HRP. P < 0.05. ANOVA with post hoc Tukey’s. (F) Images of crystal violet–stained cells after fibroblast migration to the bottom of the transwell. Data are representative of three independent experiments. (G) Schematic of the experimental design of the wound healing assay. Human lung fibroblasts were treated with TGF-β1 to stimulate differentiation into myofibroblasts and H2O2 production. MPO or HRP were added to stimulate oxidation of tyrosine residues. After the matrix was decellularized, an insert was added to divide the chamber, and lung epithelial cells were plated on each side of the insert. After cells attained confluence, the inserts were removed and the cells were imaged at 0 and 24 h. (H) Percentage of wound closure that occurred at 24 h normalized 0 h. Data show mean ± SD compared to Veh control. n = 3 independent experiments with 3 technical replicates per experiment. * indicates significantly decreased epithelial cell wound closure compared to Veh. P < 0.05, ANOVA with post hoc Tukey’s. (I) Images of epithelial cell wound closure on matrices isolated from fibroblasts that were treated with vehicle, MPO, or HRP. Dashed red lines indicate the original gap in the epithelial layer resulting from removing the well insert. Data are representative of 3 independent experiments.

