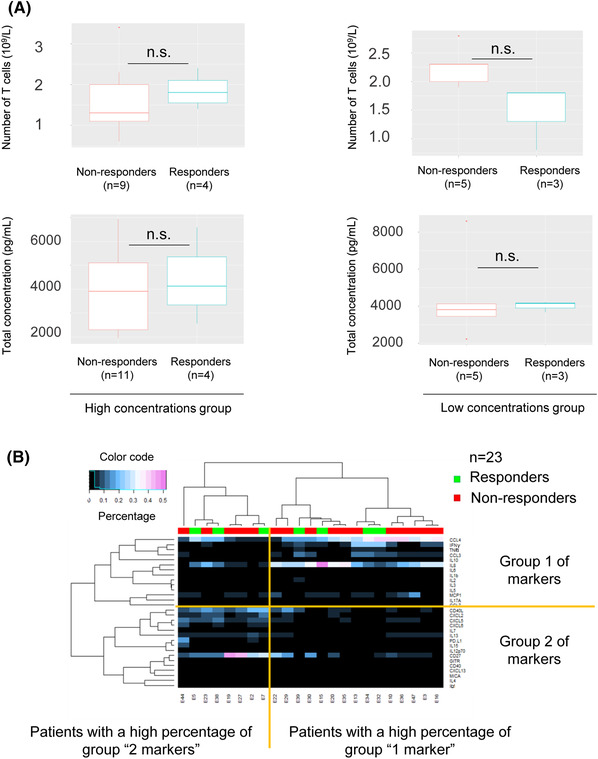
FIGURE 2.

(A) Comparison of the number of T‐cells and total concentration (e.g. total concentration of the 30 targets) for responders and non‐responders in both groups. Significance code: .01 ‘*’; .05 ‘.’; .1 ‘n.s.’; 1, Wilcoxon test. (B) Study of the amplified immunological signature of 23 patients by multiplex analysis (Luminex). Heat map of correlation of normalized concentrations (%). The structure of the data is preserved, the clustering of patients and analytes are similar (dendrograms): two groups of patients associated with two different groups of targets. Group 1 contains the 10 markers previously studied in Figure 1.
