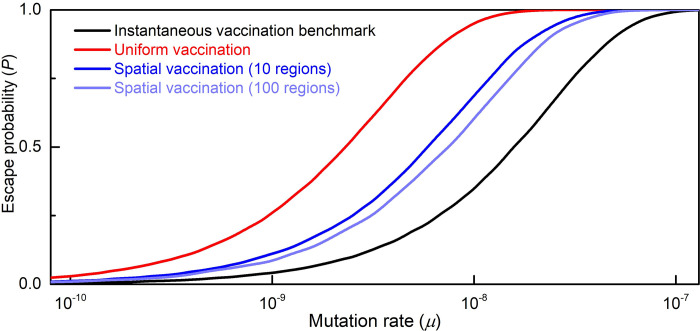
Fig 4. Probability of vaccine escape as a function of the mutation rate under various vaccination regimes.
For mutation rates between 10−10 and 10−7, the probability of escape under the current regime of uniform one-year vaccination (red curve) is far higher than under the benchmark of instantaneous world vaccination (black curve). Spatial vaccination with K = 10 regions (dark blue curve) subject to the same one-year constraint restores about 50% of the excess risk. Increasing the number of regions to K = 100 (light blue curve) generates a modest additional gain.

