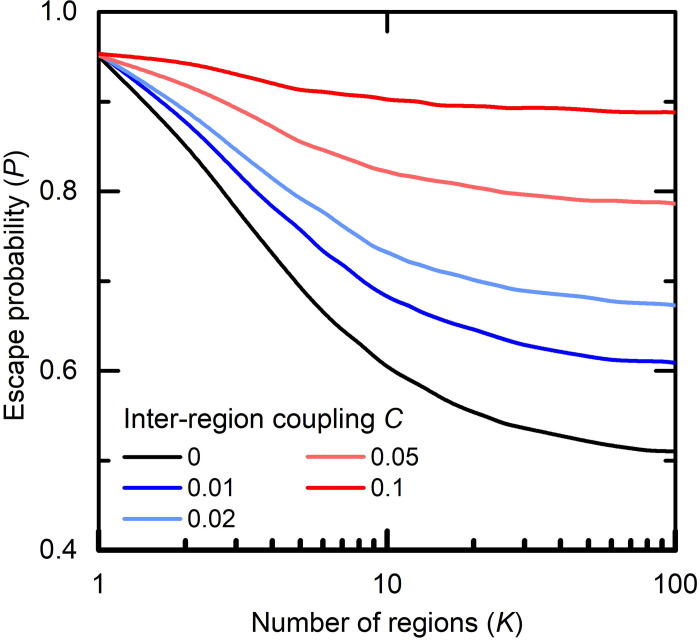
Fig 5.
The number of regions vs. the separation between regions (for μ = 10−8): In the case of a contact ratio of 1% (blue line) or 2% (light blue line) we observe a steep reduction in the probability of escape as the number of regions K increases up to about 20; the benefit of increasing K further is limited (the curves almost flatten out). With a contact ratio of 5% (orange) or 10% (red) the benefit of increasing K is small, so that C = 5% and K = 10 is equivalent to C = 1% and K = 3. The black line indicates the ideal limit at which there are no contacts between regions (C = 0).

