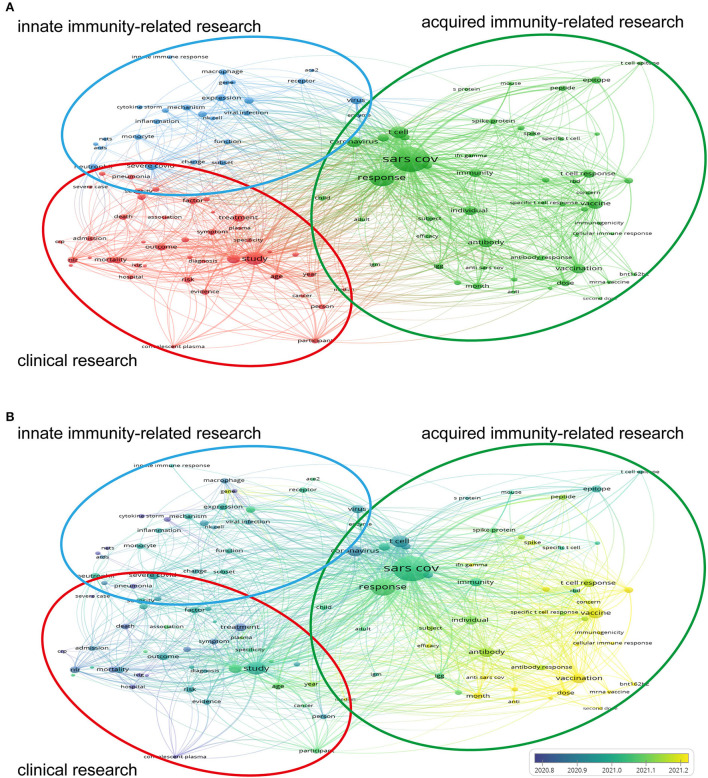
Figure 4.
Cluster analysis diagram of research hotspots. Keywords that appeared at least 85 times in titles and abstracts were analyzed by VOSviewer software. The larger the circle of the keyword, the more frequently it appeared. The co-occurrence times of two keywords determined the distance between them. (A) The keywords were classified into three clusters: clinical research (red), acquired immunity-related research (green), and innate immunity-related research (blue). (B) Keywords were colored in chronological order. Purple keywords were the early-emerging ones, whereas keywords in yellow appeared more recently.

