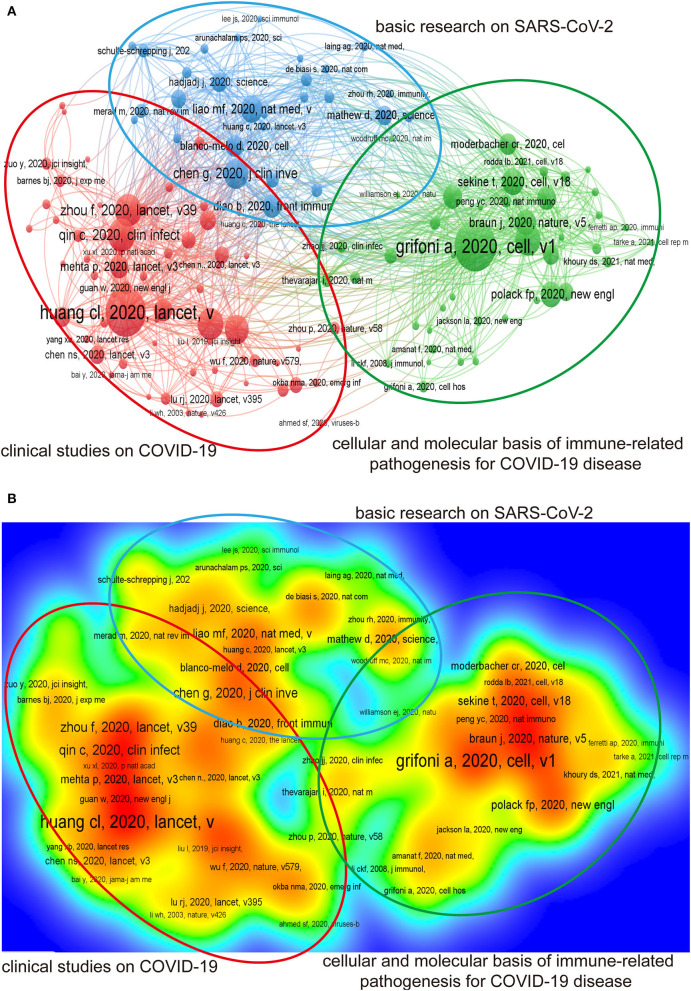
Figure 5.
Cluster analysis plot of references for co-citation. Top 139 articles cited at least 50 times were analyzed by VOSviewer. (A) Each circle in the figure represented a reference of co-citation, and the circle size was proportional to the number of citations. All references were divided into 3 clusters according to their contents: clinical studies on COVID-19 (red), basic research on SARS-CoV-2 (blue), and the cellular and molecular basis of immune-related pathogenesis for COVID-19 disease (green). (B) The thermodynamic chart of references. All references of co-citation were colored difference according to their citations. References with the highest number of citations were marked in red.

