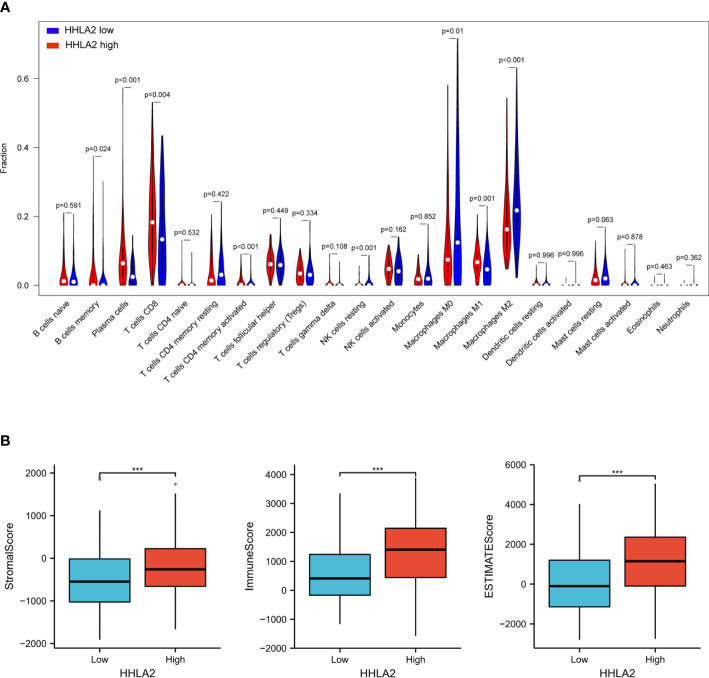
Figure 3.
Associations among HHLA2, tumor immune infiltration and the tumor microenvironment in SKCM. (A) Varied abundances of 22 infiltrating immune cell types in high and low HHLA2 expression groups. (B) Association between high/low HHLA2 expression group and TME score. ***P<0.001. P values <0.05 are in bold.

