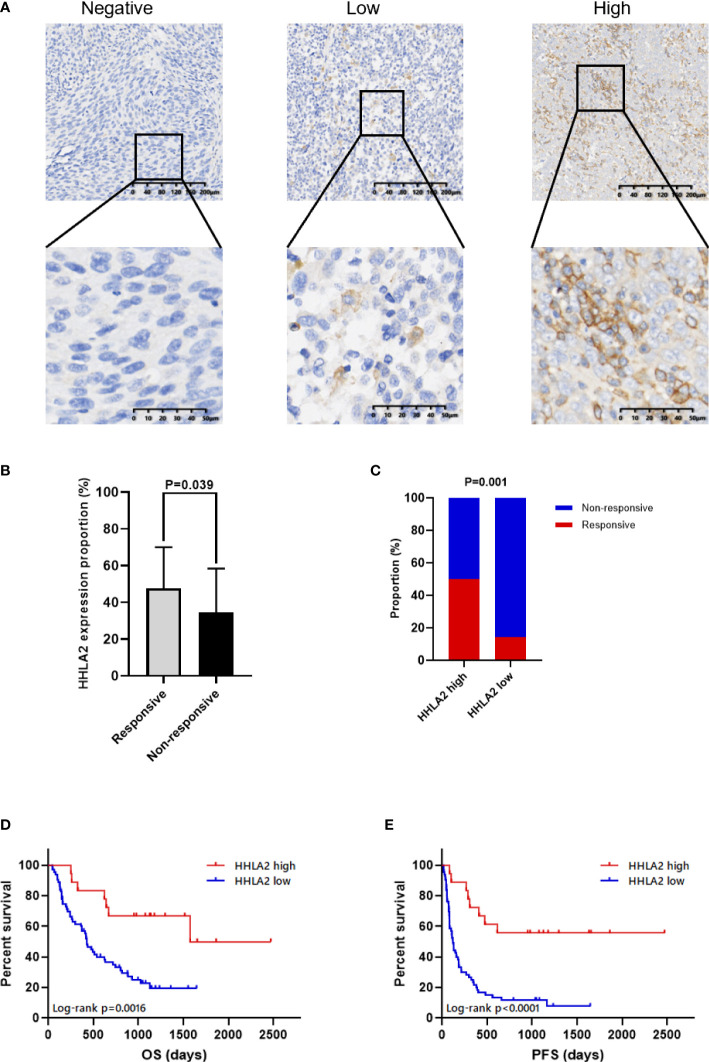
Figure 5.
The association between HHLA2 expression and response to ICB in patients with melanoma. (A) Representative micrographs of HHLA2 expression in tumor. (B) The proportions of HHLA2 expression in tumor tissues from ICB-treated responders and non-responders (unparalleled t-test, p=0.039). (C) The response rates of ICB-treated patients in high and low HHLA2 expression group (χ2 test, p=0.001). (D) KM curves illustrated that high HHLA2 expression was associated with improved PFS after ICB therapy. (E) KM curves showed that high HHLA2 expression was related to improved OS after ICB treatment. P values <0.05 are in bold.

