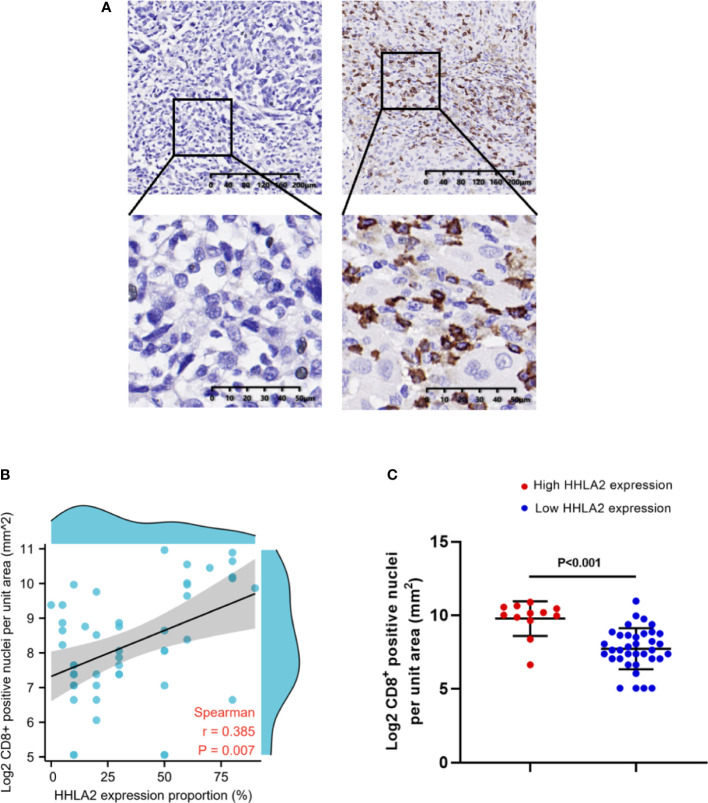
Figure 6.
The association between tumor infiltrating CD8+ T cells and HHLA2 expression. (A) Representative micrographs of CD8 expression and the corresponding negative controls in tumors. (B) The association between HHLA2 expression and CD8+ T cells (Spearman r=0.385, p=0.007). (C) Higher HHLA2 expression was significantly correlated with more intra-tumor CD8+ T cells (unparalleled t-test, p<0.001). P values <0.05 are in bold.

