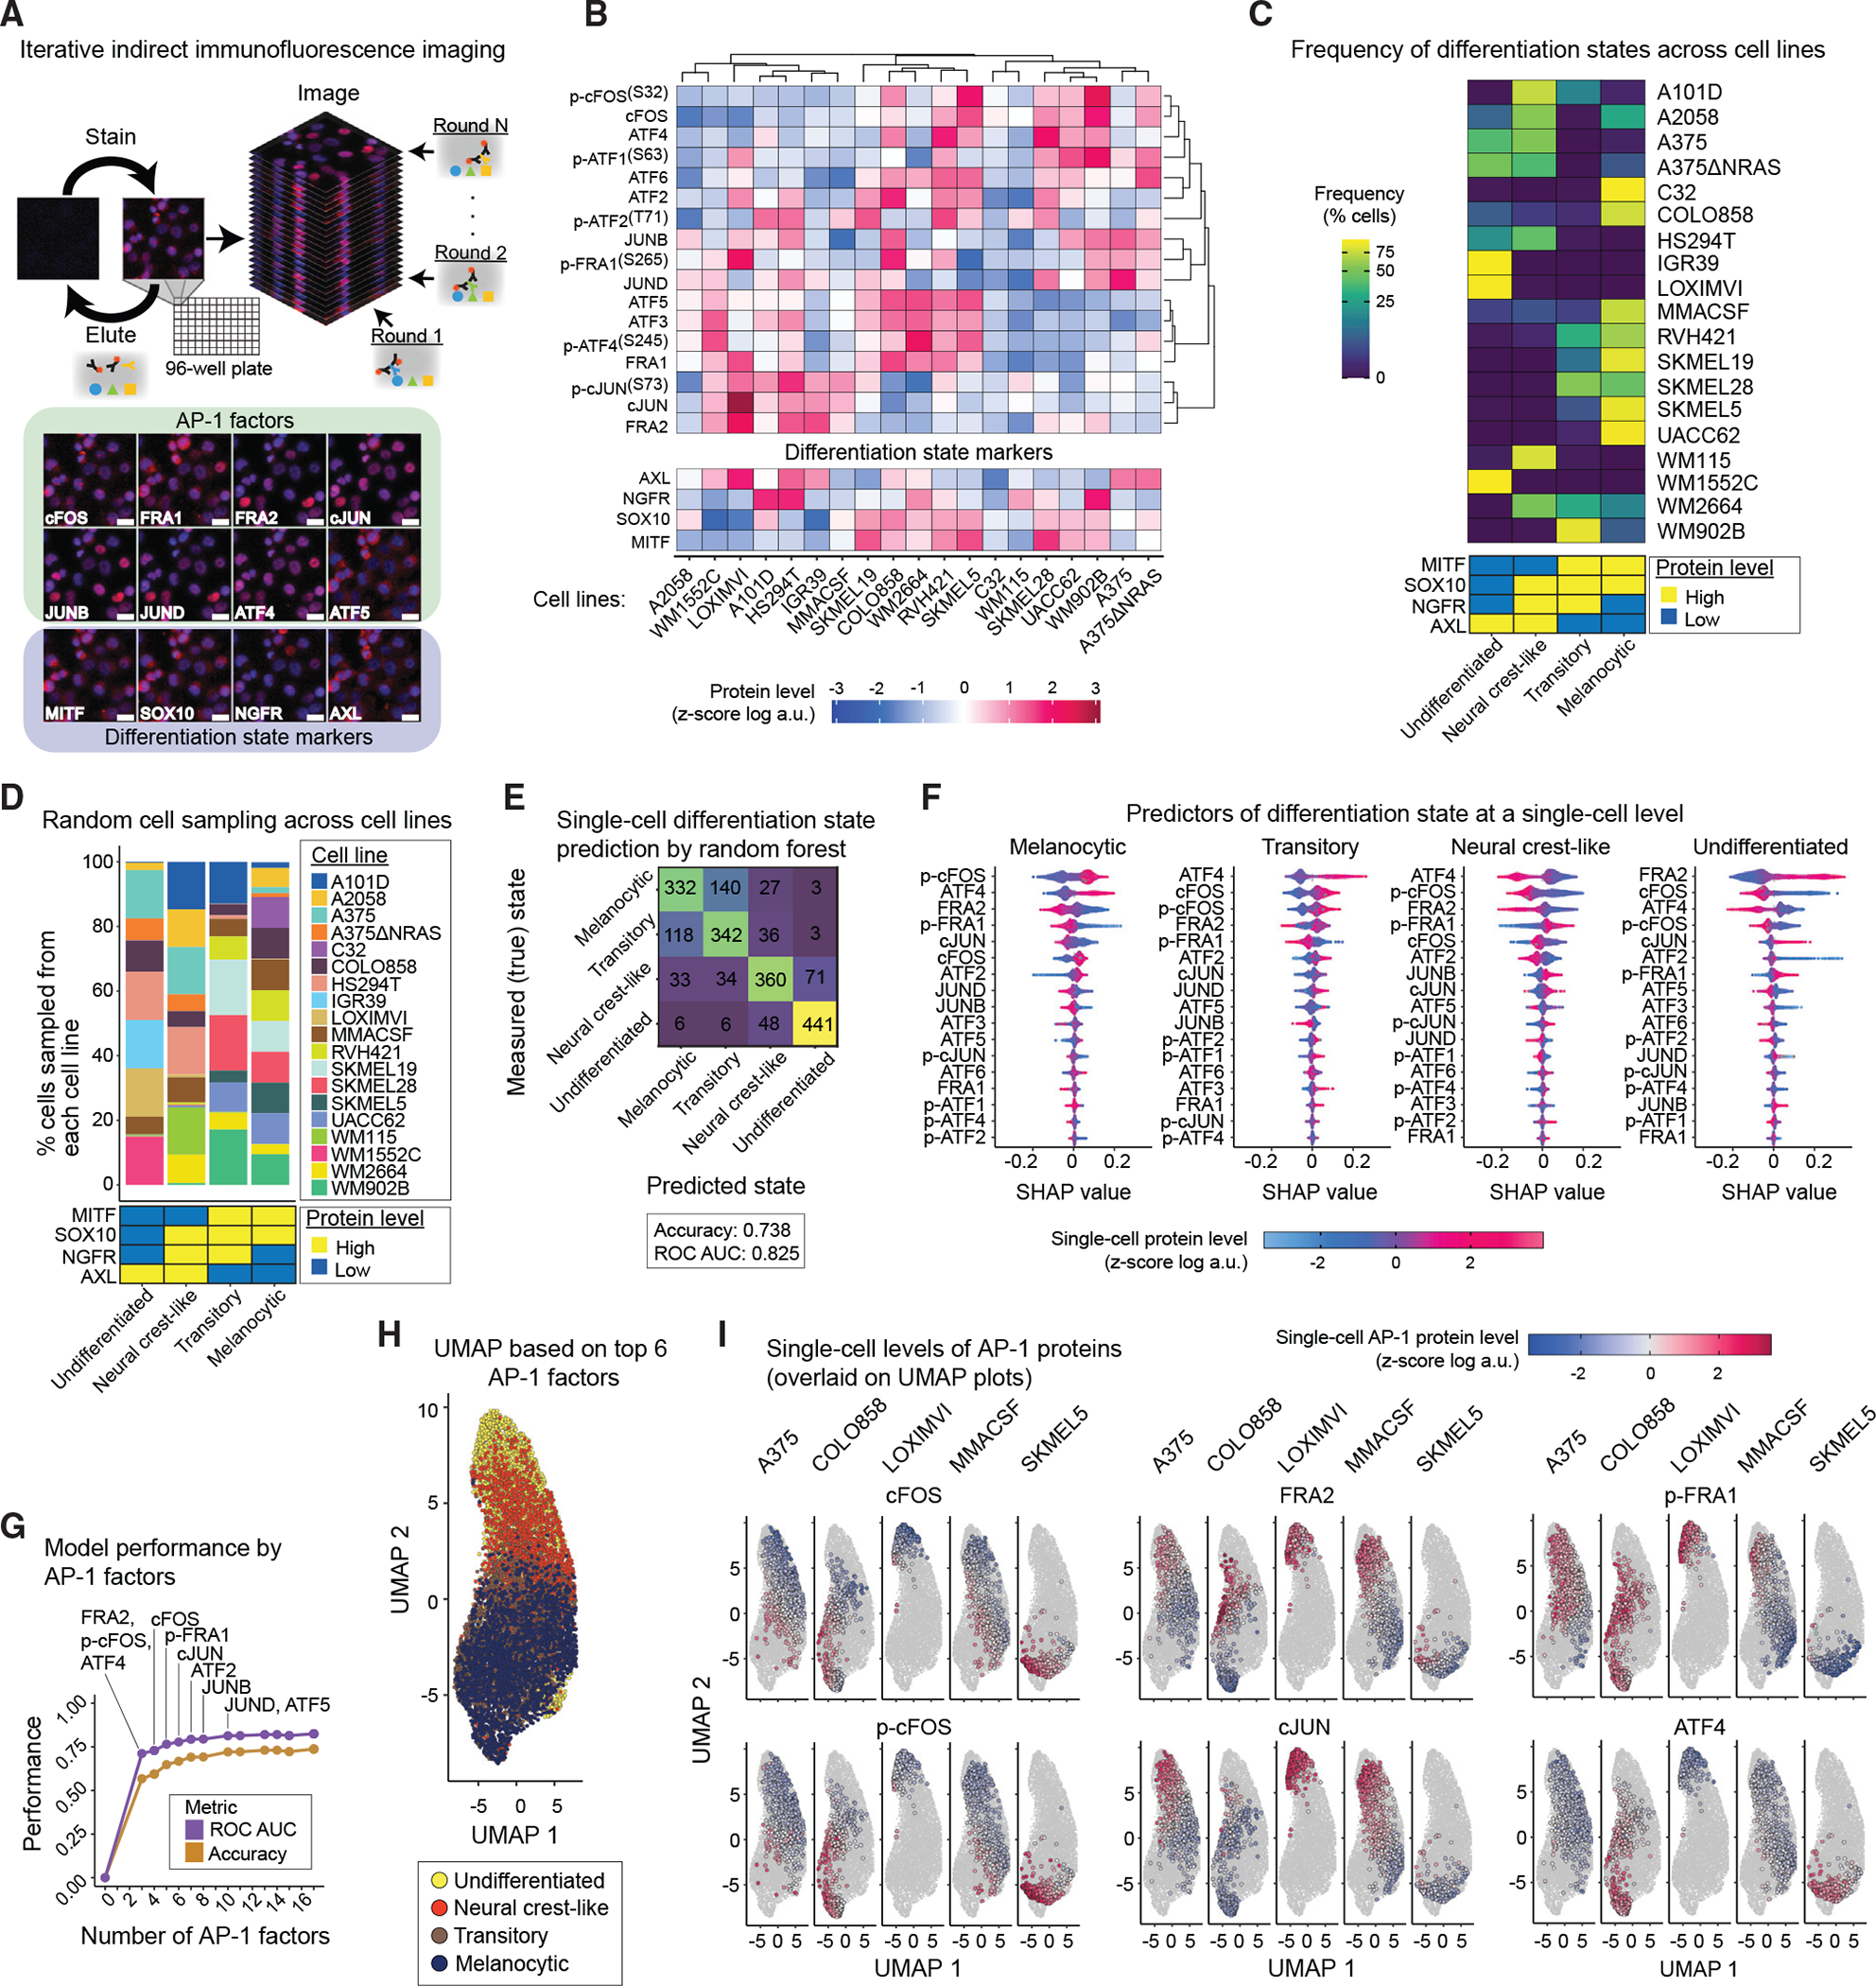
Figure 1. Single-cell AP-1 protein levels predict differentiation state heterogeneity in melanoma cells.

(A) Schematic representation of the iterative indirect immunofluorescence imaging (4i) procedure used in this study to generate multiplexed single-cell data on 17 AP-1 proteins and 4 differentiation state markers. Representative images of selected AP-1 transcription factors and differentiation state markers are shown for LOXIMVI cells. Scale bars represent 20 μm. Hoechst staining of nuclei is shown in blue, while staining of the indicated protein is shown in red.
(B) Population-averaged measurements of 17 AP-1 proteins and 4 differentiation state markers acquired across 19 BRAF-mutant melanoma cell lines. Protein data shown for each condition represent the log-transformed mean values for two replicates, followed by Z scoring across all cell lines. Data are organized only on the basis of hierarchical clustering of AP-1 protein measurements with Pearson correlation distance metric and the average algorithm for computing distances between clusters.
(C) Natural frequency of cells in each differentiation state (defined on the basis of MITF, SOX10, NGFR, and AXL levels) across 19 BRAF-mutant melanoma cell lines.
(D) The percentage of cells sampled from each of the 19 cell lines and their corresponding differentiation states used in the random forest model.
(E) Confusion matrix showing the independent validation performance of the random forest classifier in predicting the differentiation state of cells on the basis of single-cell AP-1 measurements. The model was trained using a group of 8,000 cells and validated using an independent group of 2,000 cells. The prediction accuracy and area under the receiver operating characteristic curve (ROC AUC) are shown as an overall measure of the classifier performance.
(F) Distributions of shapley additive explanations (SHAP) scores for each AP-1 factor across individual cells from the independent validation set. The color indicates the Z score-scaled, log-transformed level of each AP-1 protein at a single-cell level. For each differentiation state, AP-1 factors are ordered on the basis of the mean absolute values of their SHAP scores.
(G) Classification performance of the random forest model on the basis of varying numbers of top AP-1 factors (on the basis of their SHAP values) used as pre-dictors.
(H) UMAP analysis of the sampled melanoma cells (as shown in D) on the basis of their multiplexed levels of top 6 predictive AP-1 measurements (FRA2, p-cFOS, ATF4, cFOS, p-FRA1, and cJUN). Cells are colored on the basis of their differentiation states.
(I) Single-cell levels of the top six AP-1 proteins overlaid on UMAP plots for representative cell lines.
