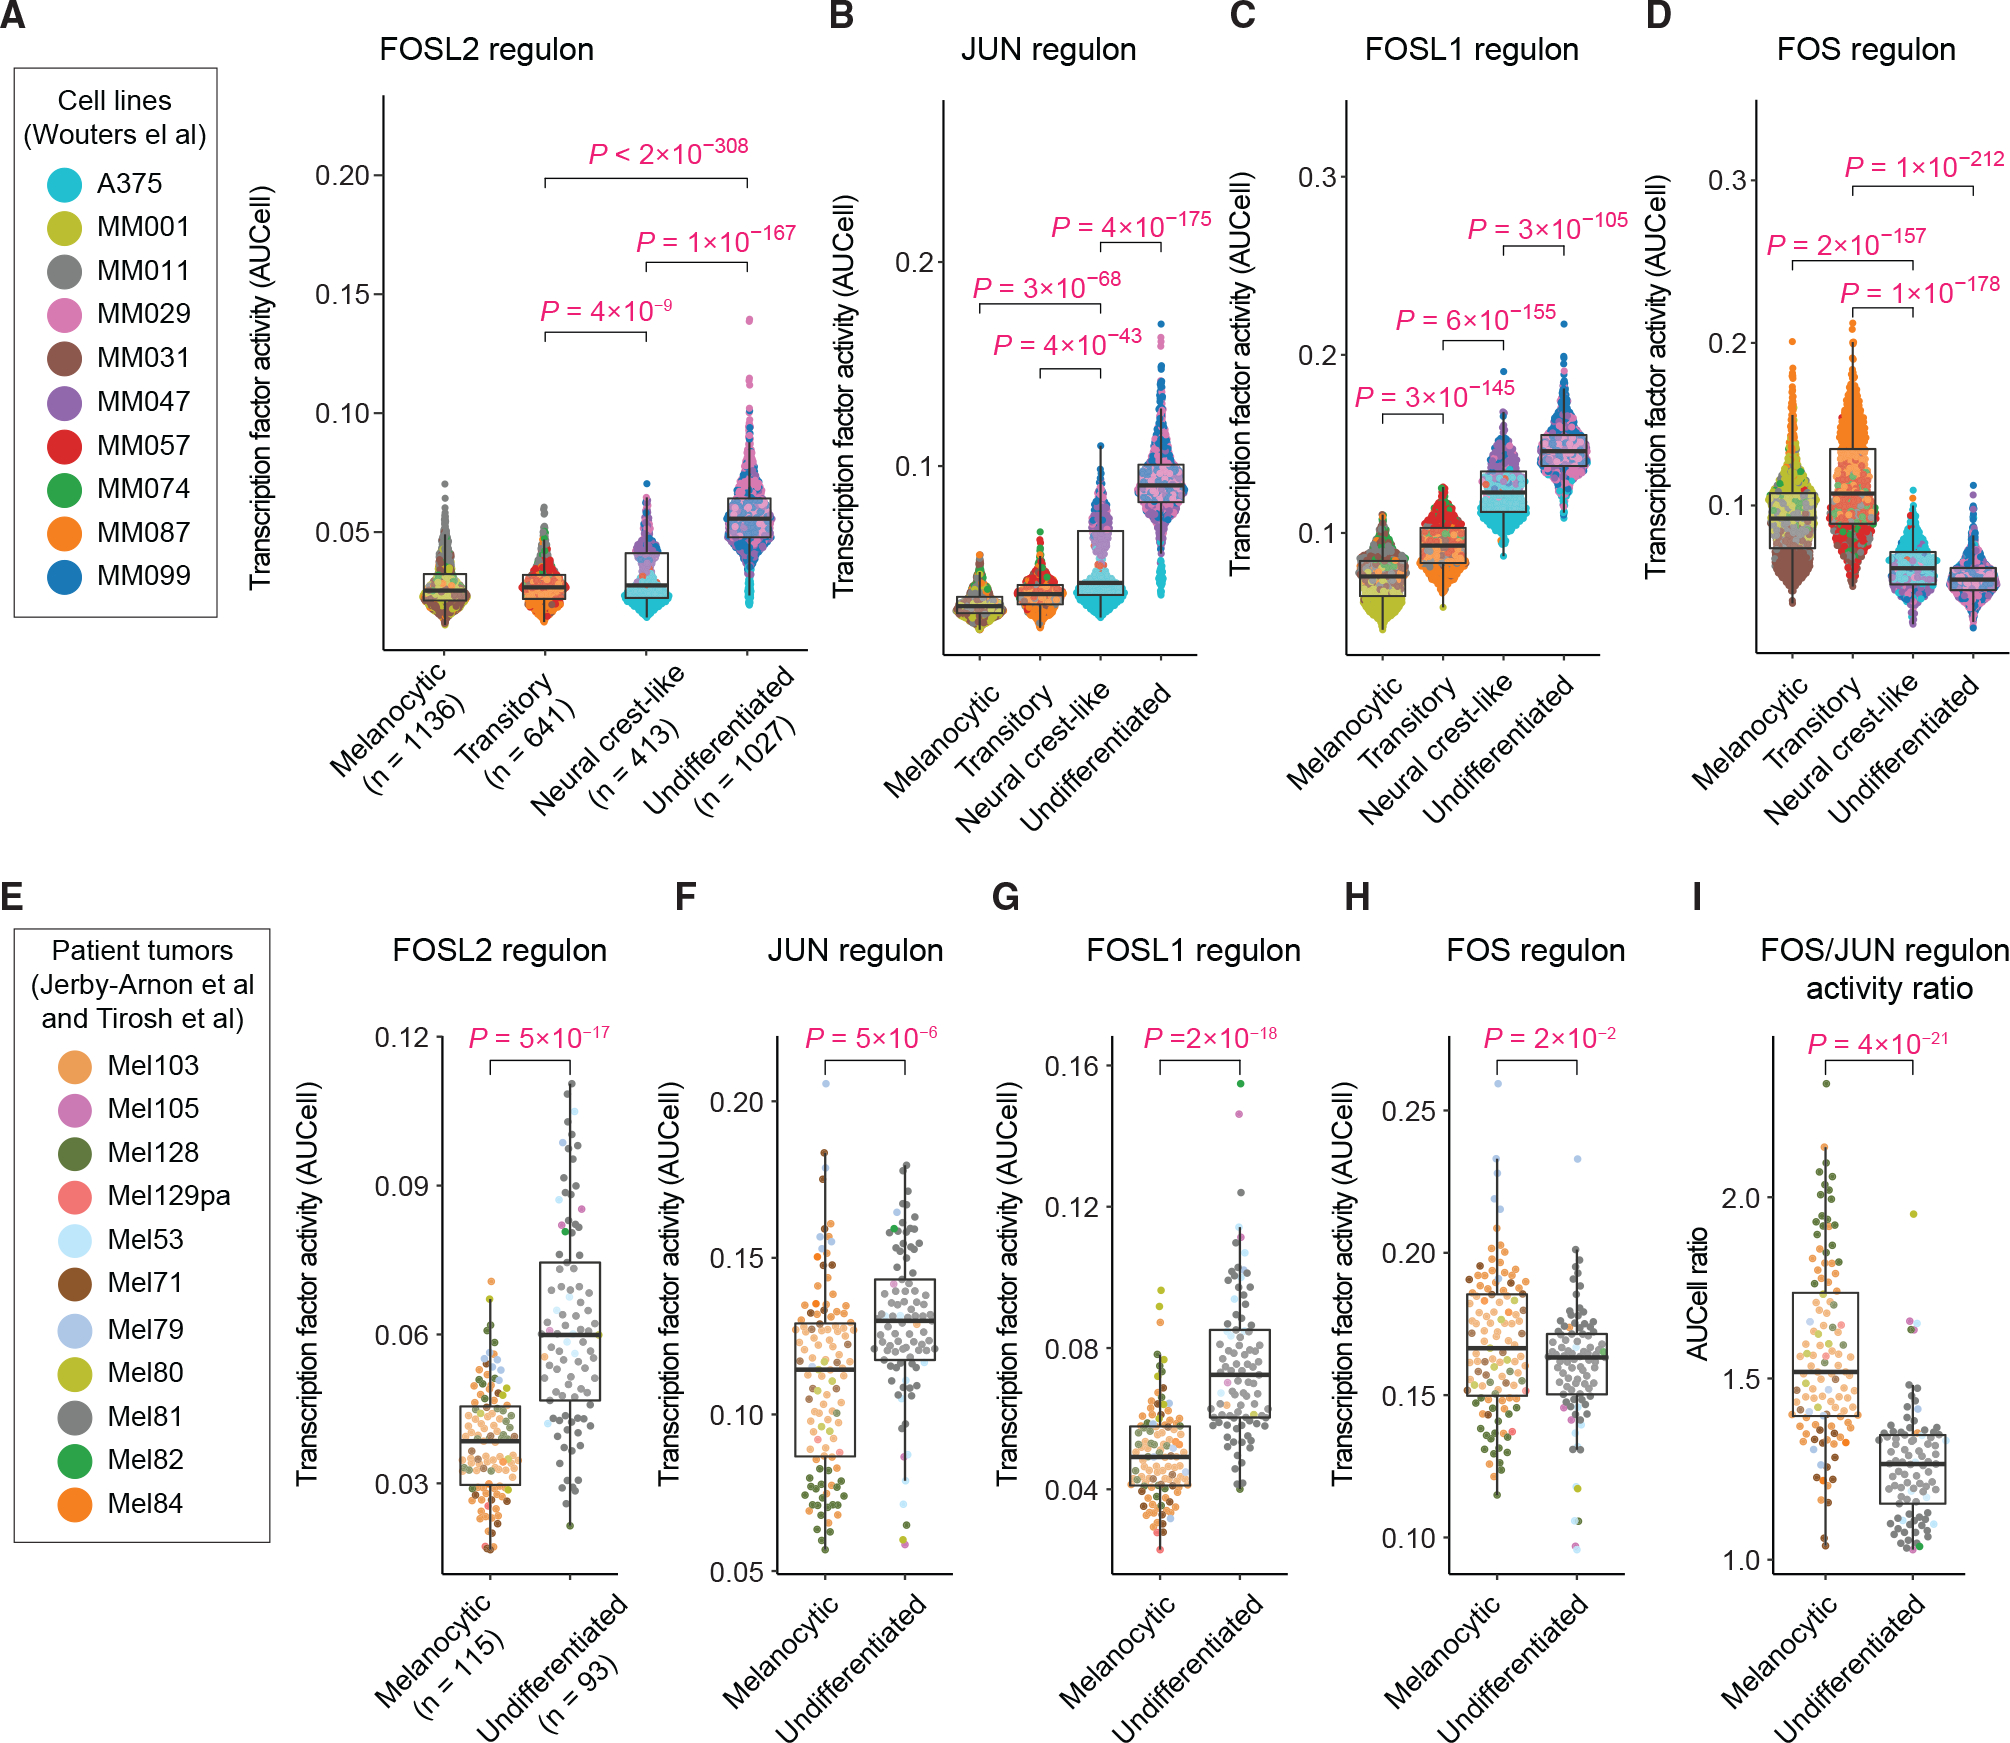
Figure 3. Single-cell network inference reveals the role of AP-1 activity in regulation of differentiation state programs.

(A–D) Single-cell distributions of the activity of SCENIC regulons for FOSL2 (A), JUN (B), FOSL1 (C), and FOS (D) motifs, measured using AUCell in individual cells (from 10 melanoma cell lines profiled by Wouters et al.) across distinct differentiation states. The differentiation state of individual cells was determined on the basis of their gated levels of enrichment (quantified by AUCell) for the differentiation gene signatures as defined by Tsoi et al.
(E–I) Single-cell distributions of the AUCell activity of SCENIC regulons for FOSL2 (E), JUN (F), FOSL1 (G), and FOS (H) motifs, as well as the ratio of FOS and JUN regulon activities (I), quantified in individual cells from 11 treatment-naive melanoma tumors as profiled by Tirosh et al. and Jerby-Arnon et al. Statistical comparisons were performed using two-sided unpaired t tests. Boxplot hinges correspond to the lower and upper quartiles, with a band at the median. Whiskers indicate 1.5 times interquartile ranges.
