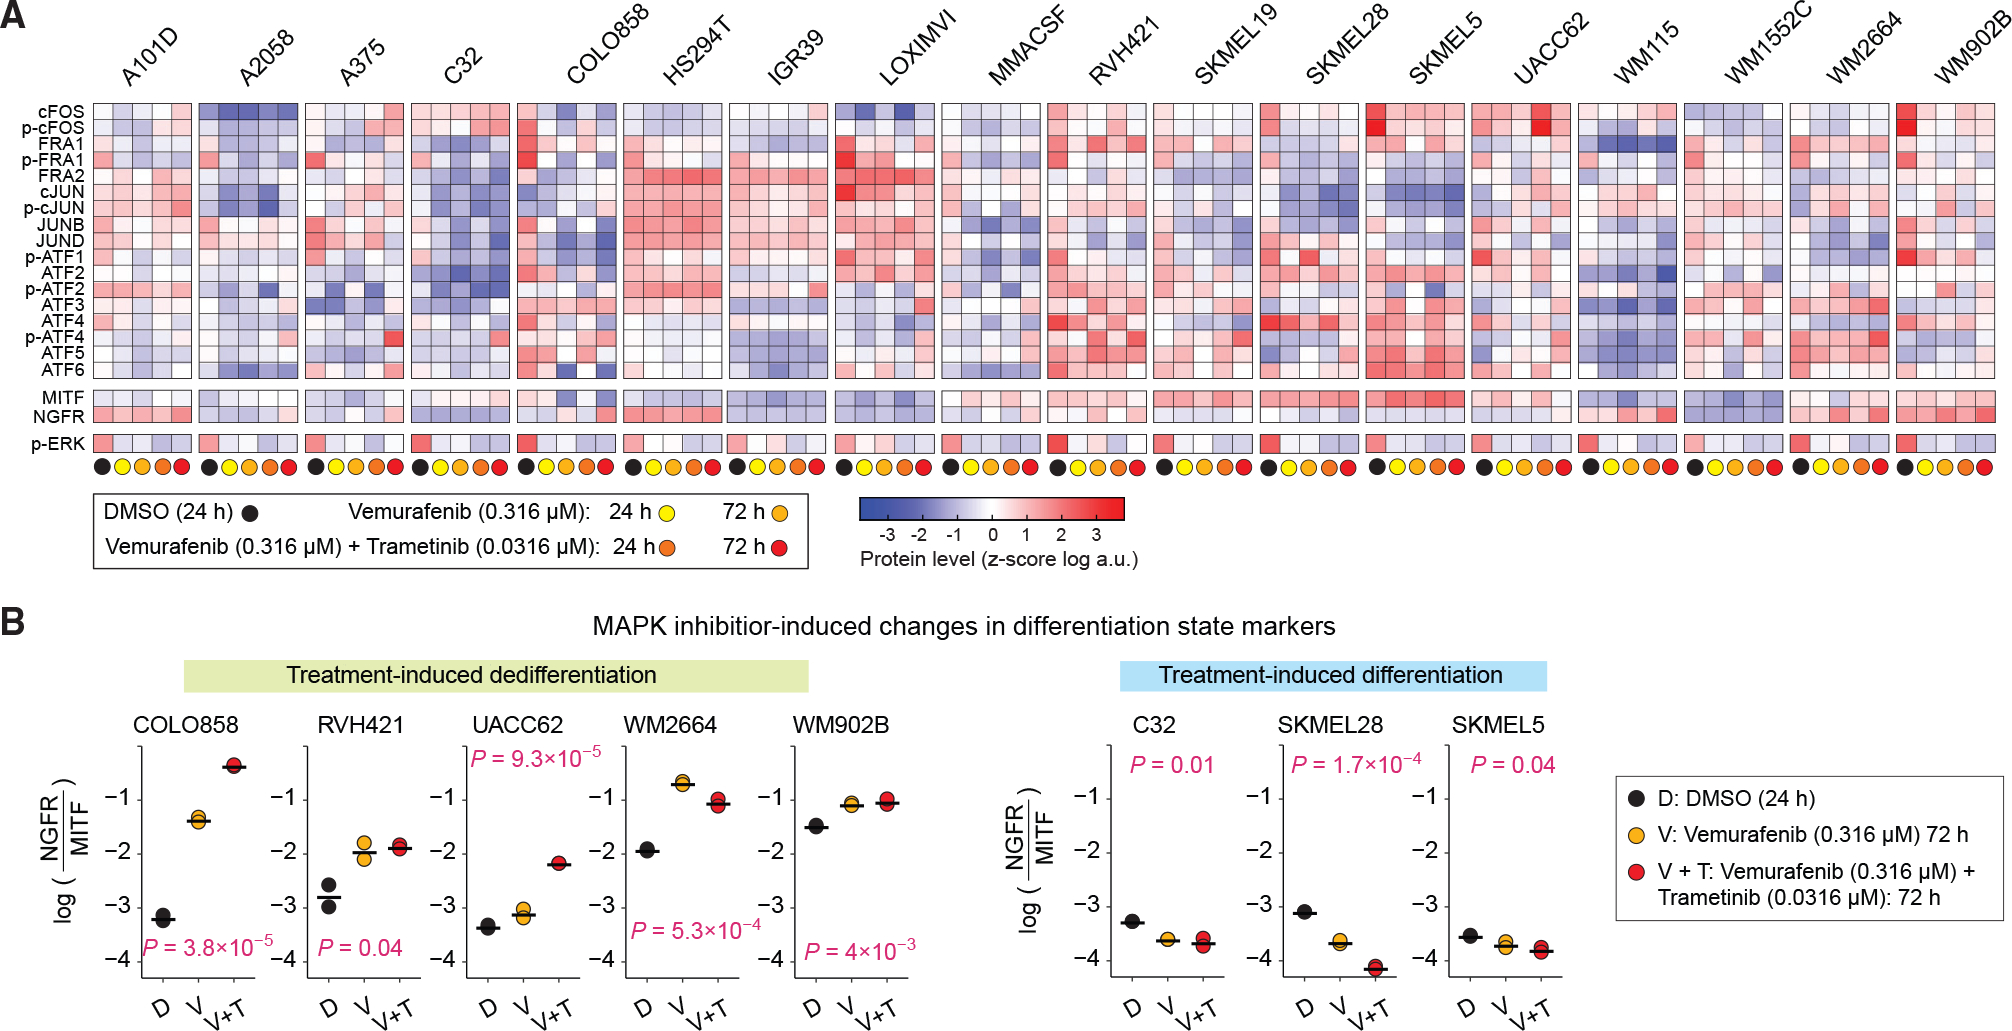
Figure 4. MAPK inhibitor-induced changes in AP-1 protein levels, p-ERK and differentiation state markers.

(A) Population-averaged measurements of 17 AP-1 proteins, differentiation state markers MITF and NGFR, and p-ERKT202/Y204 levels acquired across 18 BRAF-mutant melanoma cell lines. Protein data shown for each condition represent the log-transformed mean values for two replicates, followed by Z scoring across all cell lines and treatment conditions, including DMSO, vemurafenib alone (at 0.316 μM), or the combination of vemurafenib (at 0.316 μM) and trametinib (at 0.0316 mM) for 24 or 72 h.
(B) MAPK inhibitor-induced changes in differentiation state, as evaluated by log-transformed ratio of NGFR to MITF protein levels across cell lines at 72 h. Central marks on the data points indicate the mean between two replicates. p values represent one-way ANOVA test for differences across treatment conditions in each cell line.
