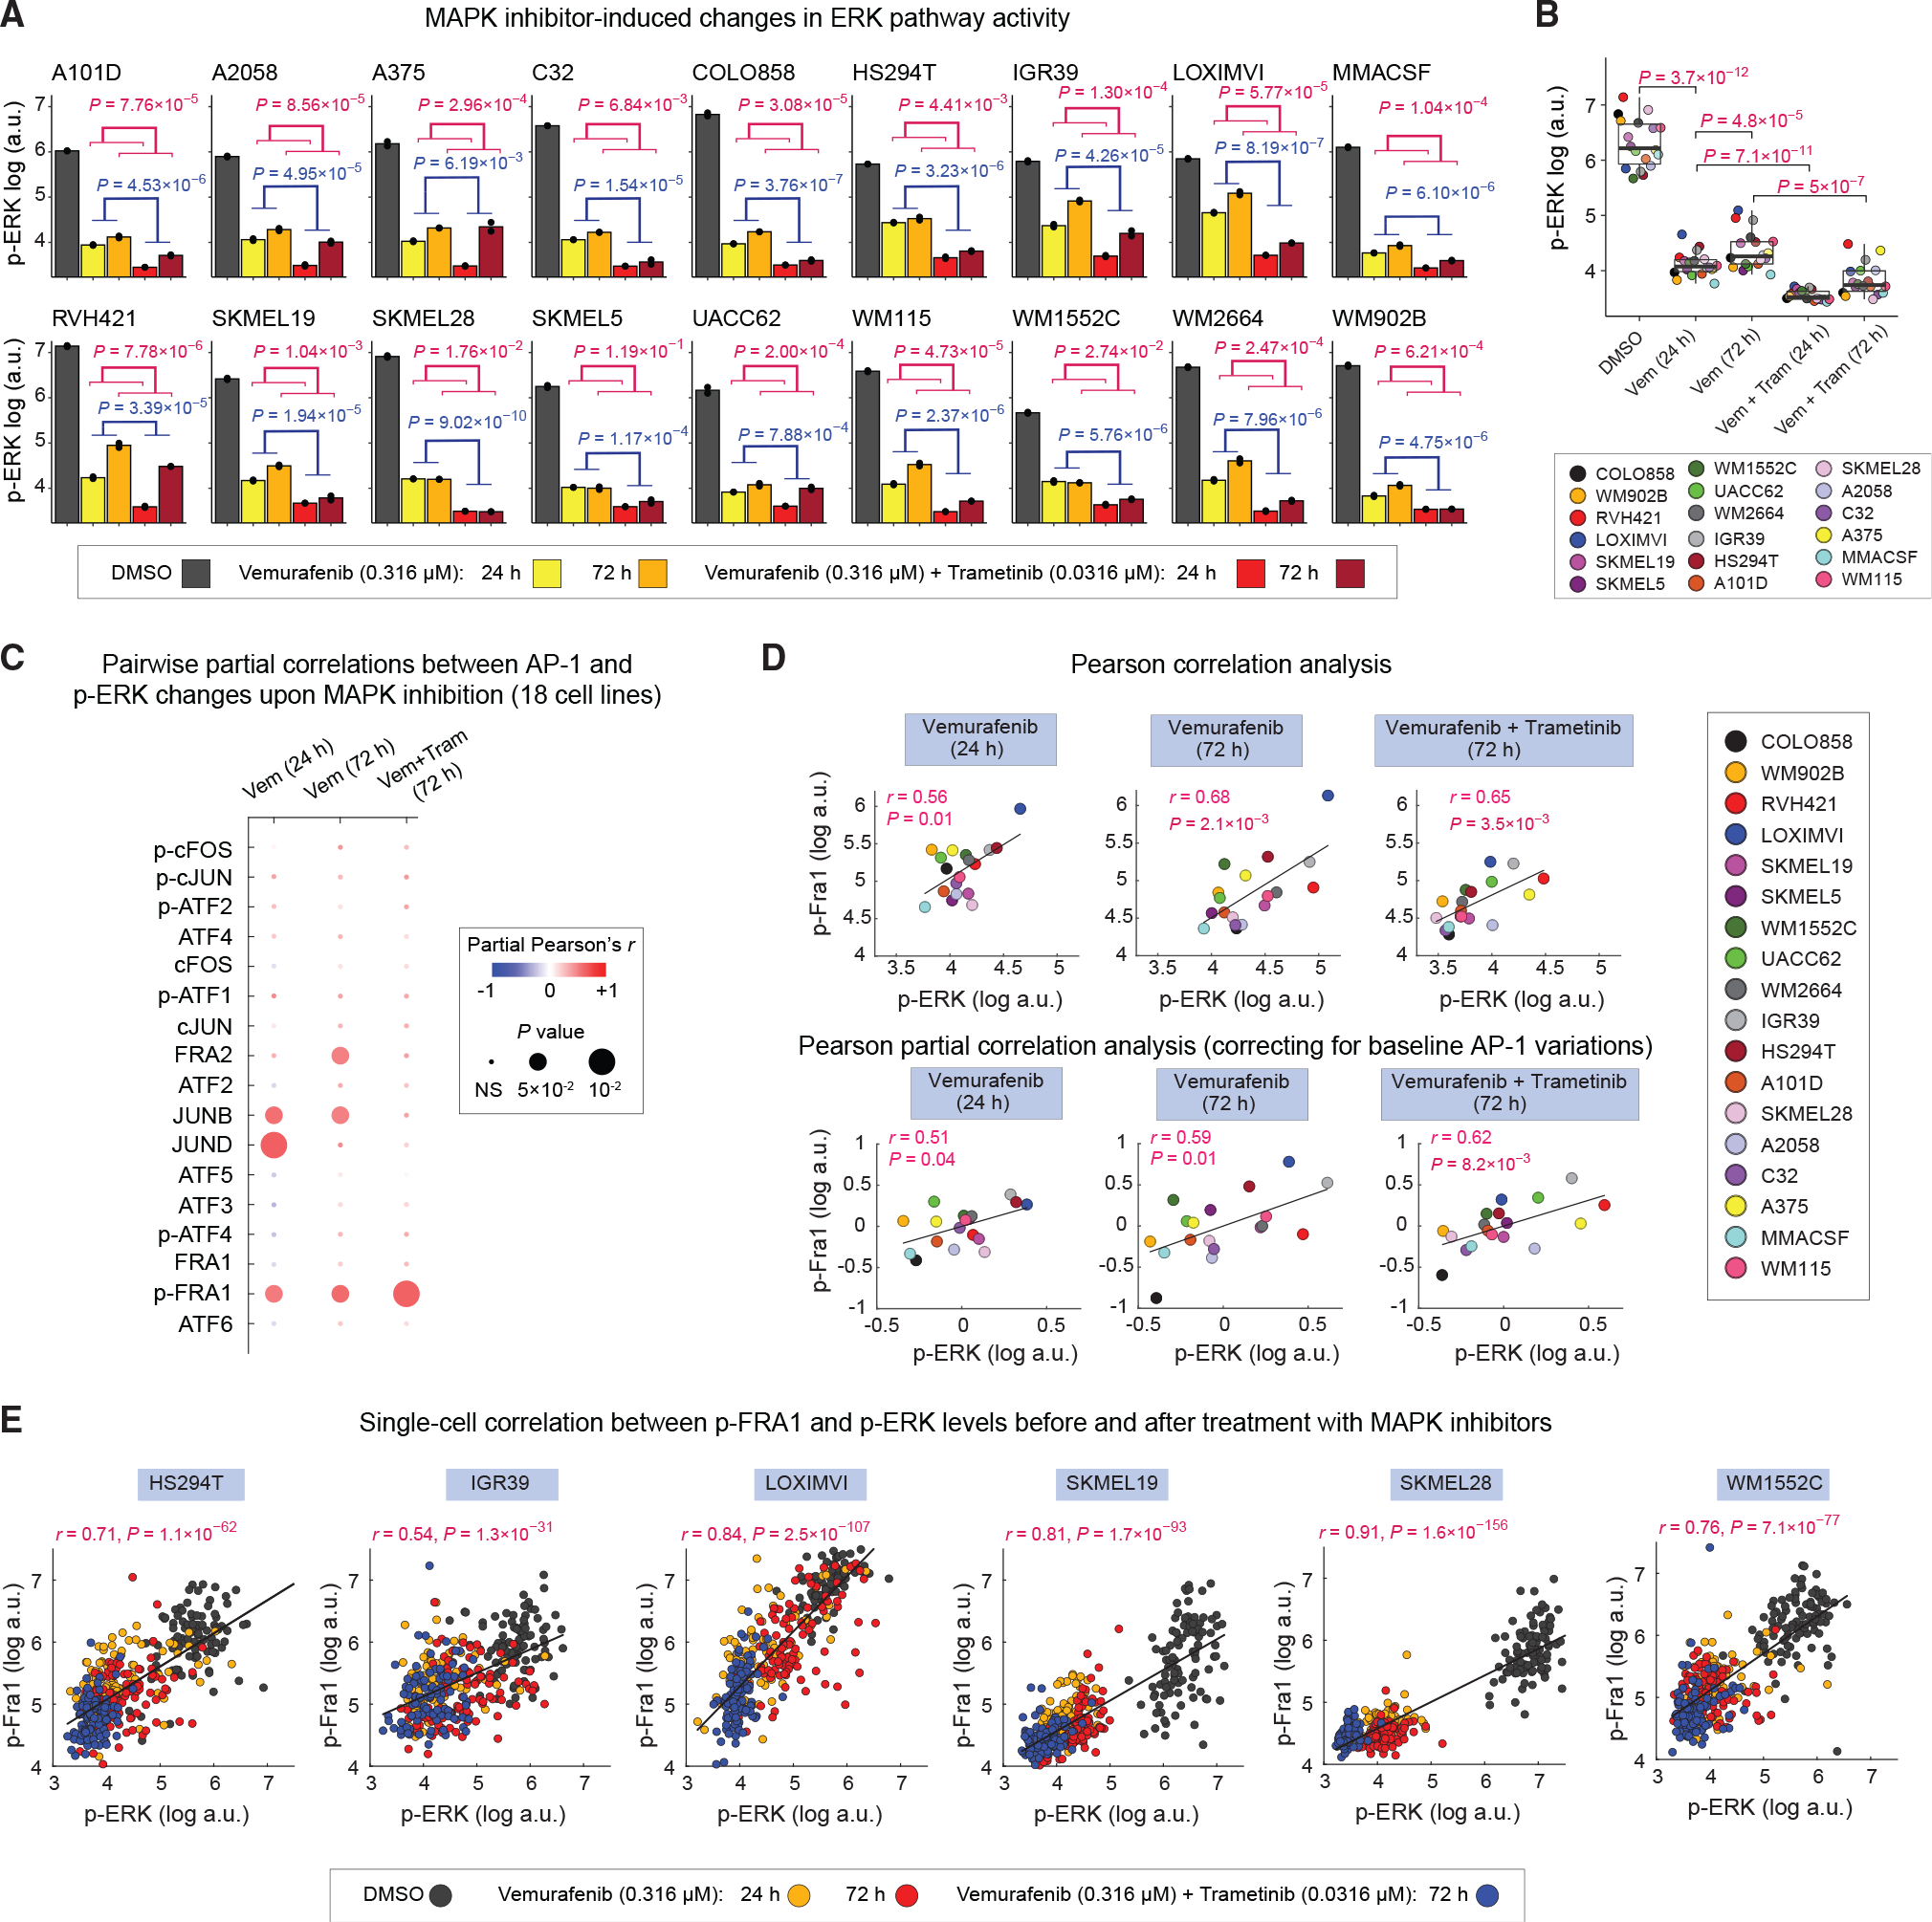
Figure 6. MAPK inhibitor-induced changes in p-FRA1 levels correlate with efficiency of ERK pathway inhibition across cell lines.

(A) Population-averaged measurements of p-ERKT202/Y204 levels in 18 cell lines following indicated MAPK inhibitor treatments for 24 or 72 h. Bar height indicates mean values between two replicates shown as black dots. p values show the statistical significance of the impact of MAPK inhibitor treatment (blue) or time (red) on p-ERK levels on the basis of two-way ANOVA.
(B) Statistical comparison (using two-sided paired t test) of p-ERK levels across 18 cell lines following indicated MAPK inhibitor treatments for 24 or 72 h. Each data point represents population mean of p-ERK levels between two replicates for each cell line.
(C) Pairwise partial correlations (evaluated across 18 cell lines) between each of the 17 AP-1 measurements and p-ERK levels following 24 or 72 h of treatment with MAPK inhibitors, while correcting for the corresponding baseline (drug-naive) AP-1 levels in the same cell lines.
(D) Pearson’s correlation (top row) and partial correlation (bottom row) between p-ERK and p-FRA1 levels following MAPK inhibitor treatments at indicated time points. Each data point represents population mean of p-ERK levels between two replicates for each cell line.
(E) Analysis of covariance between p-FRA1 and p-ERK levels across indicated MAPK inhibitor treatment conditions at the single-cell level. For each cell line, Pearson’s correlation coefficient was calculated on the basis of 400 randomly sampled cells (100 cells from each treatment condition).
