. 2022 Jul 28;11:e71032. doi: 10.7554/eLife.71032

Figure 4. Persistent speed is related to the period of oscillations.

(a) Schematics of dipoles distribution highlighting quantities used in the theoretical model: two dipolar units (‘A’ and ‘B’) made up of disks of radius a, through which cells exert traction forces on the extracellular environment. The dipoles, at distance r apart, oscillate with period T, with minimum amplitude D and a maximum amplitude D+d. (b) Model dynamics. Left: Alternate phases of extension/contraction are imposed to the two dipoles, defining a cycle (‘1, 2, 3, 4, 1...’) that is not time-reversible. Right: The extension/contraction rates of dipole ‘A’ and ‘B’ are shown in red and black, respectively, in unit d/T. The cell velocity, calculated using the model discussed in Leoni and Sens, 2015, is shown in green in the same units. It oscillates between positive and negative values – with a non-vanishing mean – with a period equal to that of individual dipoles. (c) Typical plot of the experimentally measured instantaneous speed of a migrating cell over time, showing oscillation with a non-vanishing mean. (d) Persistent speed as a function of speed period for control cells and cells treated with specific inhibitors: 10 µM ROCK inhibitor Y-27632; 10 µM MLCK inhibitor ML-7; 100 µM lamellipodia growth promoter C8-BPA, and 50 µM Arp2/3 inhibitor CK666. Error bars derived from acquisition time in x and pixel resolution in y, both divided by two. Each data point corresponds to one cell (see Figure 4—figure supplement 1 for the number of cells). The plot displays a decay consistent with a power law. The continuous lines show the fits for V~1/T (dark blue) and V~1/T 2 (magenta), following Equations 1 and 2 for WT cells.

Figure 4—source data 1. Persistent speed and period of cell migration trajectories.
(i) Data shown in the panel Figure 4d, persistent speed vs. period. (ii) Persistent speed for WT cells, C8-BPA-treated cells, CK666-treated cells, ML-7-treated cells and Y27632-treated cells. (iii) Period of WT cells, C8-BPA-treated cells, CK666-treated cells, ML-7-treated cells, and Y27632-treated cells. (iv) Dipole and quadrupole moments of simulated cells (migrating and non-migrating).

Figure 4.

Figure 4—figure supplement 1. Cell motion in cell derived matrix (CDM) is modified in the presence of specific inhibitors.

Figure 4—figure supplement 1.

Typical cell morphologies and typical trajectories of cells migrating over 5 hr. Bright-field and LifeAct labeling. (a) Control (n=49). (b) Blebbistatin (n=31). (c) Y-27632 (n=9). (d) ML-7 (n=24). (e) Latrunculin A. (f) C8-BPA (n=21). (g) CK666 (n=19). (h) Nocodazole. (i) Persistent speed for control and cells treated with specific inhibitors which show oscillatory behavior. Persistent speeds are: 0.79±0.44 μm/min (control, n=24); 0.25±0.10 μm/min (100 μM C8-BPA, n=7); 0.40±0.03 μm/min (50 μM CK666, n=6); 0.40±0.12 μm/min (10 μM ML-7, n=7) and 0.42±0.09 μm/min (10 μM Y-27632, n=9). (j) Average of the period of the cell speed calculated by autocorrelation analysis of speed projected on axis of migration: 17±8 min (control, n=24); 29±10 min (100 μM C8, n=7); 27±9 min (50 μM CK666, n=6); 22±9 min (10 μM ML-7, n=7) and 26±7 min (10 μM Y-27632, n=9). One-way ANOVA with Tukey’s test for multiple comparisons. The p-value is indicated on the graph, otherwise differences were non-significant. Scale bars 25 μm.
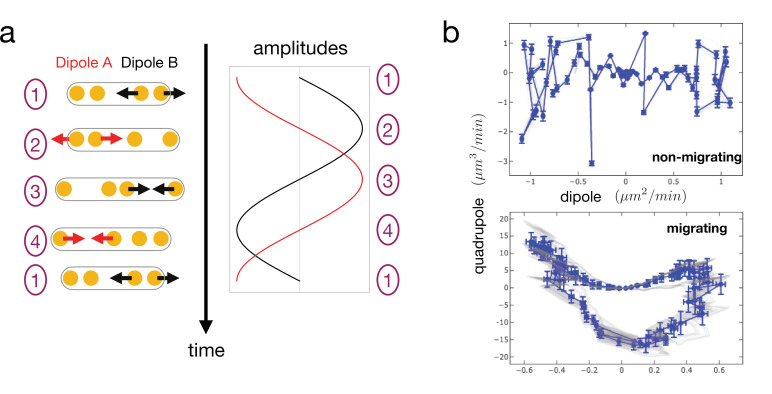
Figure 4—figure supplement 2. Simulated cell trajectories in the dipole/quadrupole phase space.

Figure 4—figure supplement 2.

(a) Reproduction of the idealized model of cell dynamics (from Figure 4b) showing alternate phases of dipole contraction/extension at the two cell ends. Sinusoidal oscillations have been chosen in this example (b) Cell trajectories in the phase space. Dipoles and quadrupoles of the strain rate are computed assuming a viscous response of the environment. In the non-migrating case, the two dipoles oscillate in phase, leading to a cycle of vanishing area (vanishing quadrupole). In the migrating case, the dipoles oscillate with a fixed phase shift ψ=π/2, leading to a cycle of finite area. In both cases, the blue trajectories are without noise and the red trajectories with added noise (random independent variation of the oscillation dynamics of the two dipoles). Error bars are computed as in Figure 3—figure supplement 1.