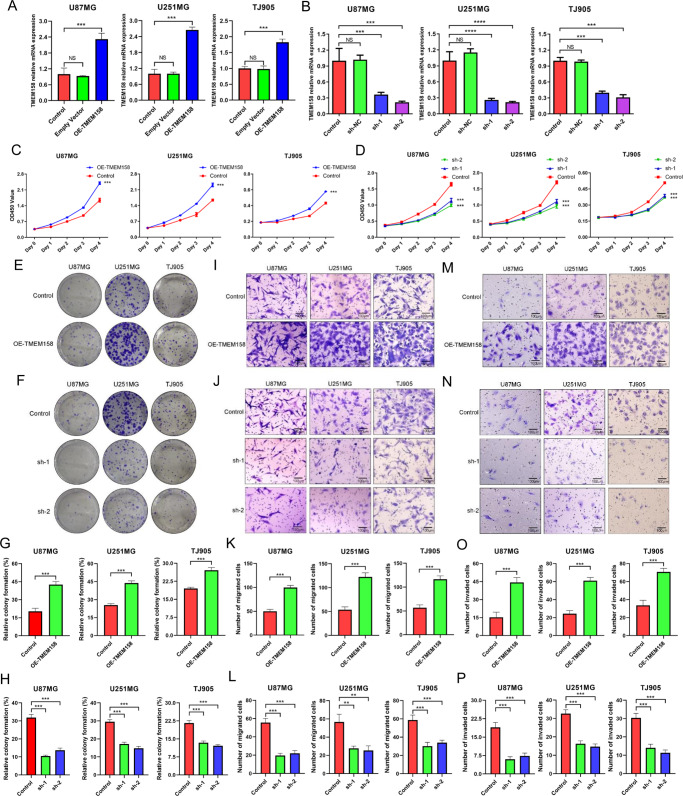
Fig. 3. TMEM158 overexpression promotes the proliferation, migration, and invasion of glioma cells.
A–B RT-PCR results showing the transfection efficiency of lentiviral overexpression (OE-TMEM158) and knockdown (shRNA-TMEM158-1, sh-1; shRNA-TMEM158-2, sh-2) and the expression of TMEM158 in U87MG, U251MG, and TJ905 glioma cell lines. C–D CCK-8 results showing the proliferation of U87MG, U251MG, and TJ905 glioma cells in response to upregulating and downregulating TMEM158 expression. E, G Colony-formation assay results showing the colony-formation efficiency of glioma cells after overexpression of TMEM158. F, H Colony-formation assay results showing the colony formation efficiency of glioma cells after silencing TMEM158 expression. I–L The migration ability in U87MG, U251MG, and TJ905 glioma cells in response to overexpression and knockdown of TMEM158 was detected by Transwell migration assay. K and L Show the statistical histogram of the quantification of migrated cells after upregulation and downregulation of TMEM158, respectively. M–P The representative images of Transwell invasion assay for glioma cell lines after gain- and loss-of-function TMEM158. The number of invaded cells is shown in (O and P). Data in (K, L, O, and P) are shown as mean ± SD. Scale bar = 100 μm. (nsp > 0.05, *p < 0.05, **p < 0.01, ***p < 0.001, ****p < 0.0001).

