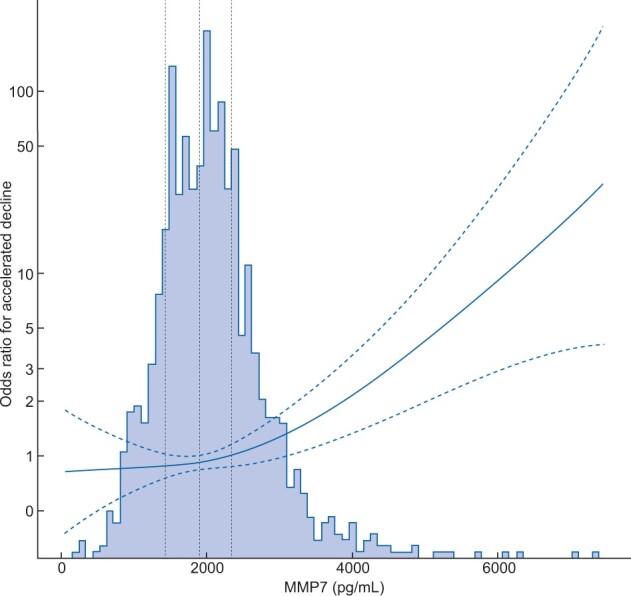
FIGURE 2.

The non-linear association between MMP7 concentration and risk of accelerated GFR decline based on Model 3 in Table 2. Baseline MMP7 concentration is on the x-axis, the ORs for accelerated decline are on the y-axis and dotted lines indicating the change point for each quartile of MMP7 concentration. The dashed lines indicate 95% CIs. MMP7 concentrations are shown as picogram per millilitre.
