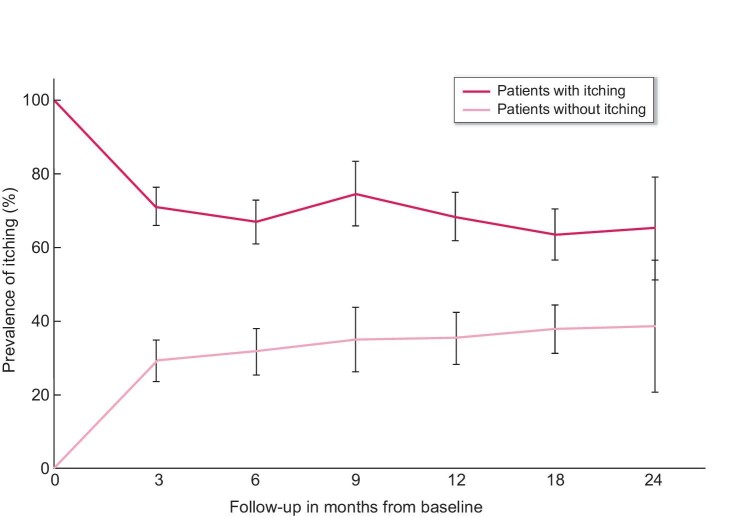
FIGURE 2:
Persistence of itching during follow-up in patients with itching (black) and patients without itching (grey) at baseline. Black solid line (black bars) shows the percentage (95% CI) of dialysis patients in which itching is persistent during follow-up since baseline. Grey solid line (grey bars) shows the percentage (95% CI) of dialysis patients in which itching was newly developed during follow-up since baseline. Note that the average time between follow-up measurements was 6.7 months, meaning that the number of patients who contribute data fluctuates across the time points in the graph.

