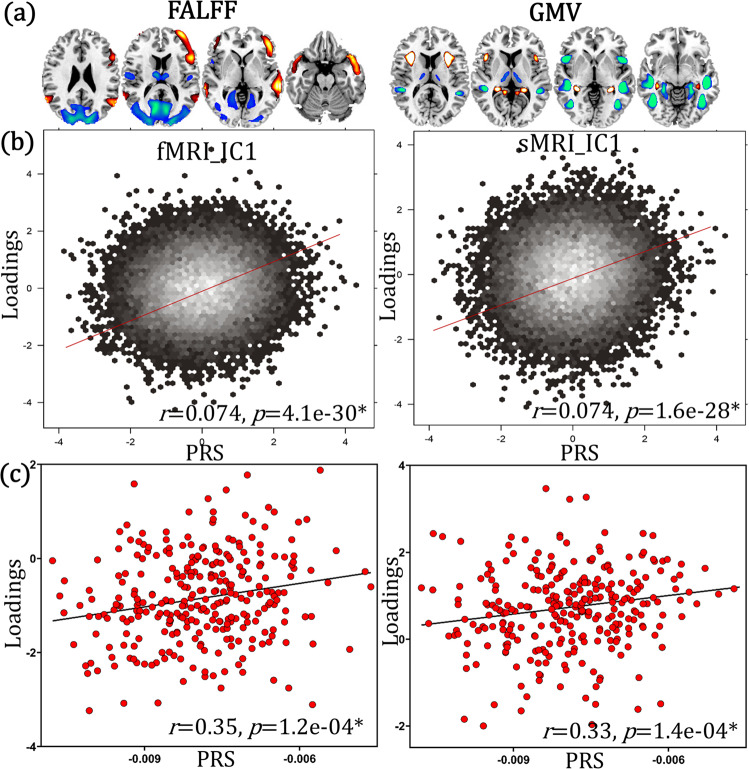
Fig. 2. The identified PRS-associated multimodal joint components in UKB healthy white people (N = 22,459).
a Spatial brain maps visualized at |Z| > 2. b 2D density plot of PRS and loadings of components in UKB (p = 4.1e−30* and p = 1.6e−28* for fMRI and sMRI respectively). c Correlations (p = 1.2e−04* and p = 1.4e−04* for fMRI and sMRI respectively) between projected (projecting spatial maps from UKB to SZ patients to obtain an estimation of their mixing matrices) loadings and PRS within SZ patients (N = 290, where PRS was available). Pearson correlation analysis was used to calculated the correlation between PRS and loadings in (a, b). Source data are provided as a Source Data file.

