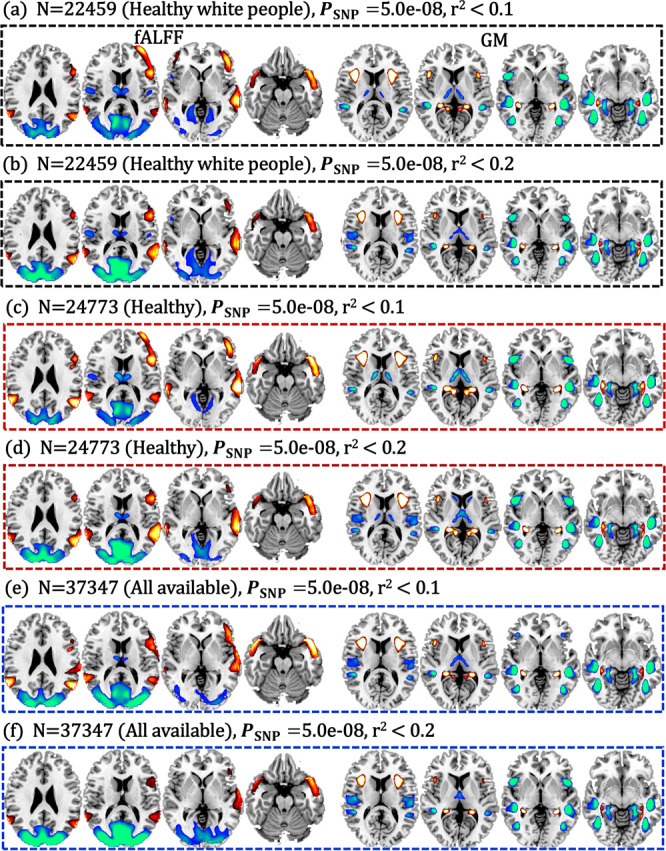
Fig. 3. Replication of the identified PRS-associated pattern within UKB.

Fusion with PRS pruned at r2 < 0.1 and pruned at r2 < 0.2 on healthy white people (N = 22,459, a, b), on healthy participants (N = 24,773, c, d), and on all the available subjects in UKB that passed MRI quality control (N = 37,347, e, f). There is high spatial overlap (>80%) among these PRS-associated patterns (details can be found in the Supplementary “Spatial similarity” section). PRS-pattern comparisons (>50%) among PSNP < 5.0e−08, 1.0e−04, 0.05 can be found in Supplementary Fig. 7.
