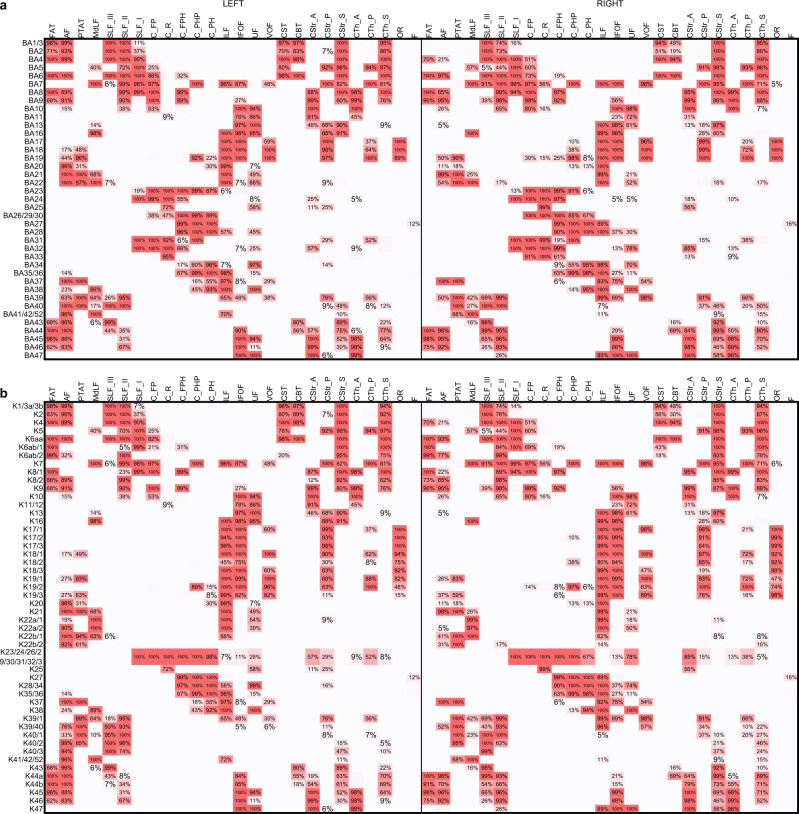
Fig. 4. The tract-to-region connectome matrices derived from the Brodmann and Kleist brain parcellations, respectively.
a The tract-to-region connectome using the Brodmann parcellation. b The tract-to-region connectome using the Kleist parcellations. The rows of the matrices correspond to each brain region defined by cortical parcellations, whereas the columns correspond to each white matter bundle. The tract-to-region connectome matrices show the population probability quantified from 1065 young adults. Probability values lower than 5% were left blank to facilitate inspection. Source data are provided as a Source Data file.

