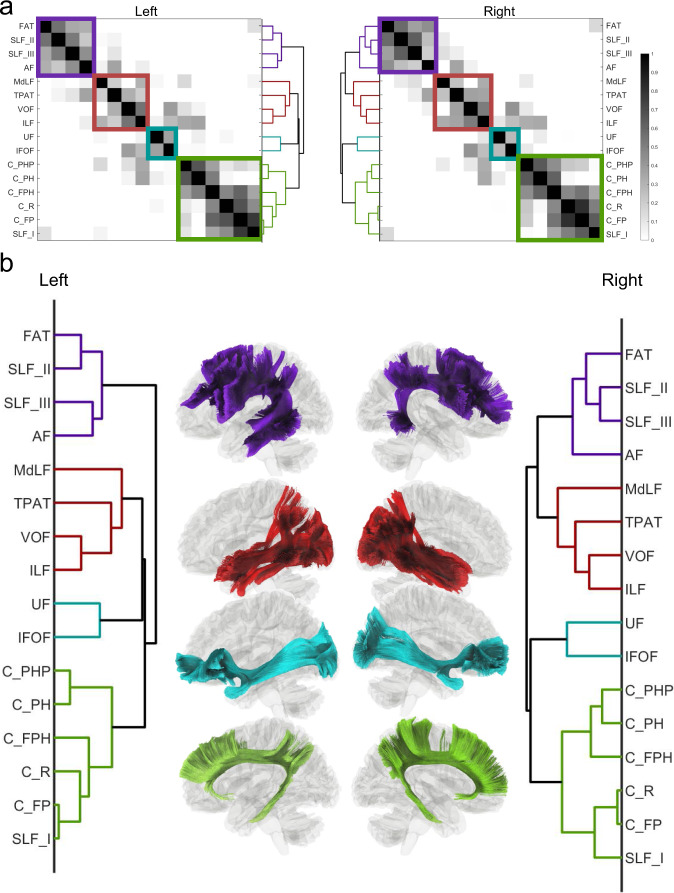
Fig. 9. Similarity matrices between association pathways and their derived dendrograms based on HCP multimodal parcellation.
a The similarity matrices were calculated by nonparametric Spearman correlation between the column vectors of the connectome matrix. b The hierarchical relation is then visualized using dendrograms computed by using hierarchical clustering. The horizontal distance in the dendrograms scales with the clustering cost. Both dendrograms show four categories of association pathways on both hemispheres, including the cingulum system (green), posterior ventral system (cyan), anterior ventral system (red), and arcuate system (purple). Source data are provided as a Source Data file. MATLAB (MathWorks©, https://www.mathworks.com/) was used to create the diagram and matrix.

