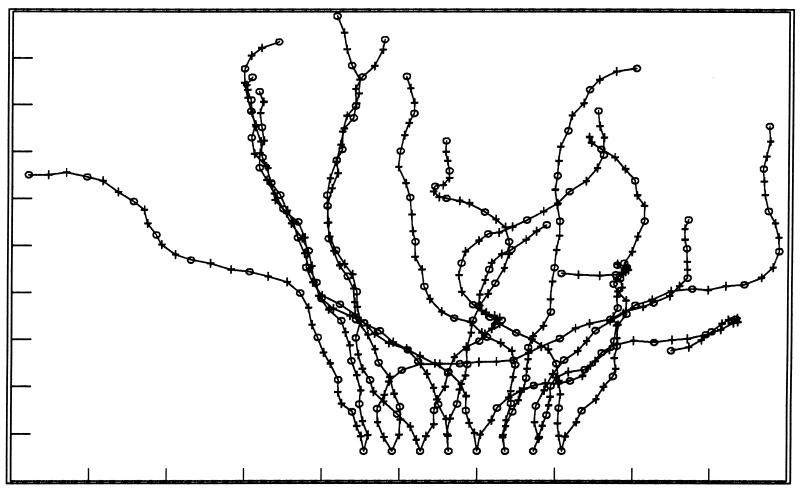
FIG. 6.
Schematic diagram showing the different alignments (i.e., movement) of the B-band O-side chains of P. aeruginosa as we perceive them from the AFM experiments shown in Fig. 5 (53). The model assumes that all ionizable groups are charged. The core oligosaccharide and lipid A moieties are not shown but would be at the bottom of the diagram.

