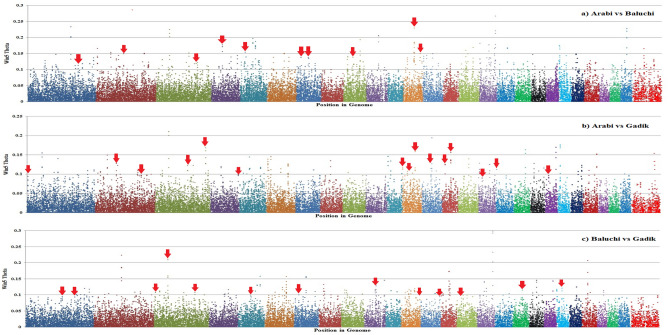
Figure 8.
Distribution of selective sweep signatures for different comparisons in Afghan sheep breeds by chromosome. SNP position in the genome is shown on the X-axis and each chromosome was highlighted in different colors, and windowed FST (Theta) is plotted on the Y-axis. The red arrows are highlighting the peaks that overlapped by CNV regions identified in our study. This figure was created using R v 4.0.2 (https://cloud.r-project.org/).

