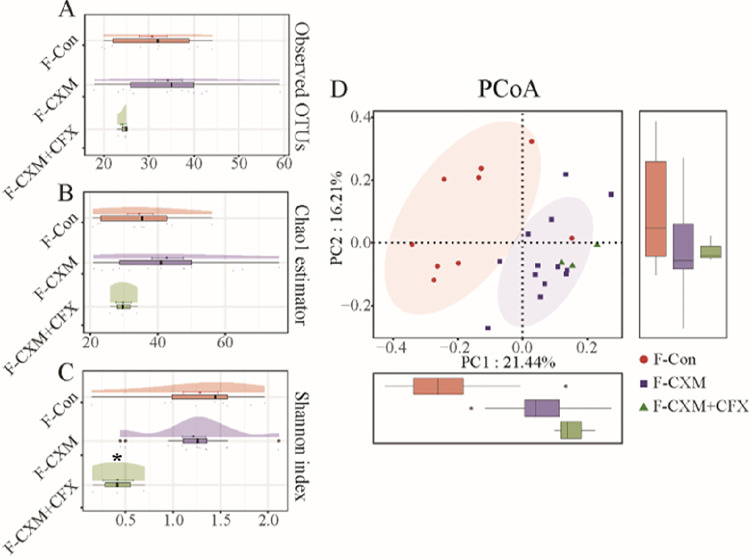
Fig. 3.
a and b-diversity indices of the gut microbiota in fecal samples from the control group (F-Con, n = 9), CXM-treated group (F-CXM, n = 13), and CXM + CFX-treated group (F-CXM + CFX, n = 3). A Observed OTUs in the gut microbiota in fecal samples; B cloud plot of the Chao1 estimator regarding the gut microbial community richness in fecal samples; C cloud plot of the Shannon index regarding the gut microbial community diversity in fecal samples; D multiple-samples PCoA analysis regarding the difference in the microbial community composition in fecal samples. Red circles represent samples of the F-Con group; purple squares represent samples of the F-CXM group; green triangles represent samples of the F-CXM + CFX group. Each box plot represents the median, interquartile range, minimum, and maximum values. *The data are statistically significantly different from the F-Con group (p < 0.05)

